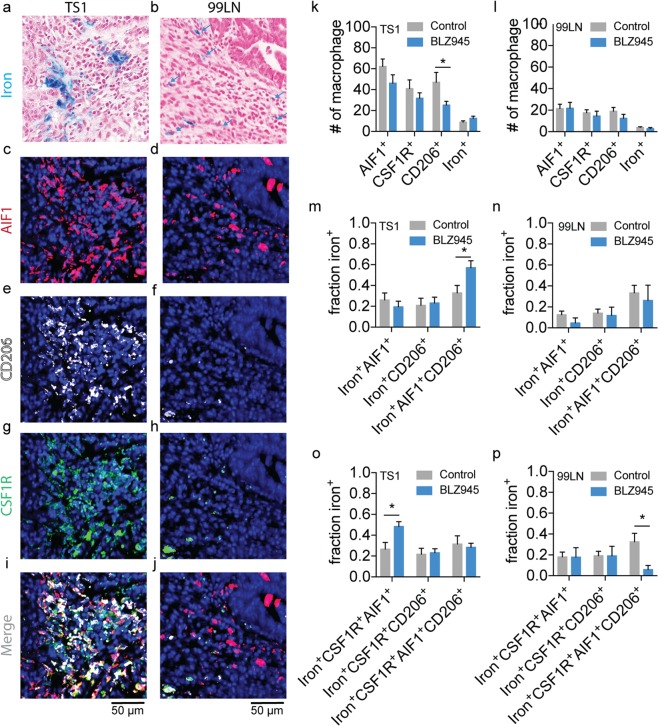
Figure 4.
Immunofluorescent and Prussian blue imaging of macrophage iron deposit polarization and CSF1R status in MMTV-PyMT murine breast cancer models of CSF1R immunotherapy. Representative registered fields centered on TAM iron deposits in MMTV-PyMT TS1 and 99LN tumors stained for iron with Prussian blue (a,b), allograft inflammatory factor-1 (AIF1, M1-like, c,d), mannose receptor (CD206, M2-like, e,f), colony stimulating factor 1 receptor (CSF1R, g,h) and the combined immunofluorescent channels(i,j). Note fields of control tumors are shown, but are representative of both control and BLZ945 treated groups. Each field is 200 µm × 200 µm. Scale bar 50 µm. Blue arrows indicate location of iron+ macrophage in 99LN field. Number (#) of AIF1+, CSF1R+, CD206+ and iron+ macrophages detected per field for control and BLZ945 treated (k) TS1 and (l) 99LN MMTV-PyMT mammary tumor models (mean + s.e.m. n = 20 fields for TS1 control and BLZ945, n = 20 fields for 99LN control and n = 7 fields for 99LN BLZ945, *p < 0.05, Mann-Whitney test). Fraction of total iron+AIF1+, iron+CD206+, and iron+AIF1+CD206+ macrophages detected per field in control and BLZ945 treated groups for (m) TS1 and (n) 99LN mammary tumor models. Fraction of total iron+CSF1R+AIF1+, iron+CSF1R+CD206+ and iron+CSF1R+AIF1+CD206+ macrophages detected per field in control and BLZ945 treated groups for (o) TS1 and (p) 99LN mammary tumor models (mean + s.e.m. n = 20 fields for TS1 control, n = 20 fields TS1 BLZ945, n = 20 fields for 99LN control and n = 7 fields for 99LN BLZ945, *p < 0.05, Mann-Whitney test).

