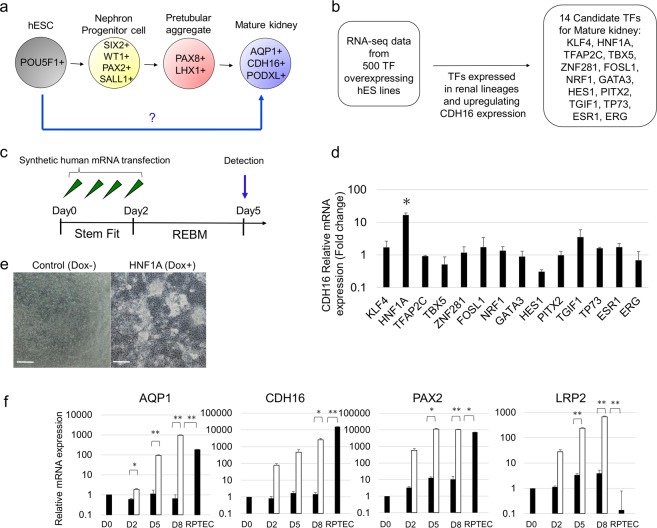
Figure 1.
Identification of a renal-lineage master regulatory TF. (a) Diagram of differentiation into mature kidney. (b) Flowchart of an approach to identify renal linage master regulatory TFs. (c) Schematic representation of time course of mRNA transfection of candidate TFs. (d) Relative mRNA expression levels of CDH16 after mRNA transfection of candidate TFs into hESCs. (e) Representative bright-field images on day 5 of differentiation. Scale bar, 100 μm. (f) Time course of gene expression of AQP1, CDH16, PAX2, and LRP2 in transgene HNF1A-induced hESCs (white bars), in transgene un-induced hESCs, and in RPTECs (black bars) by qRT-PCR from day 0 to 8 n = 2. Data represent mean + s.e.m. P-values were determined by a Student’s t-test. *P < 0.05; **P < 0.01.

