Figure 4.
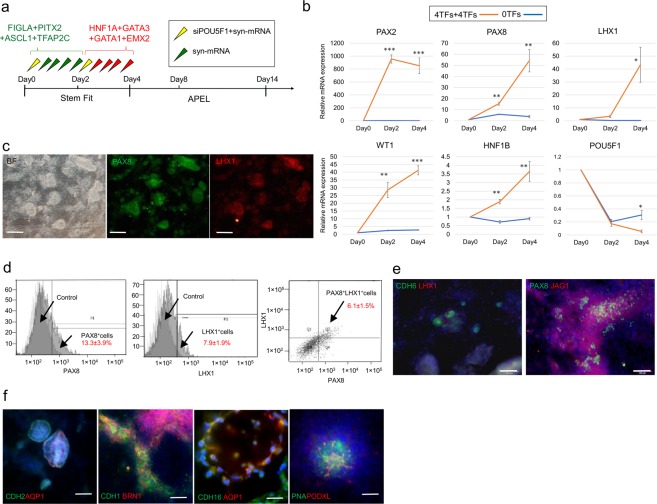
Stepwise TF cocktail administration induces nephrogenesis. (a) Schematic of the differentiation protocol from hESCs in 2D culture. (b) Relative mRNA expression levels of PAX2, PAX8, LHX1, WT1, HNF1B and POU5F1 differentiated from hPSCs. (c) Immunocytochemistry for PAX8, LHX1, markers of pretubular aggregate, on day 4 in cells differentiated from hPSCs using protocol depicted in. Scale bar, 200 μm. (d) Flow cytometry for PAX8, LHX1 in hESCs on day 4. Samples stained with secondary antibodies alone were used as controls. (e) Immunocytochemistry for CDH6, LHX1, PAX8 and JAG1, markers of renal vesicle, on day 8 in cells differentiated from hPSCs using protocol depicted in. Scale bar, 100 μm. (f) Immunocytochemistry for proximal tubule (CDH2, AQP1, CDH16), distal tubule (CDH1, BRN1), and podocyte (PODXL, PNA) on day 14. Scale bar, 50 μm. Values shown are the means ± SEM. P-values were determined by a Student’s t-test. *P < 0.05; **P < 0.01; ***P < 0.001.

