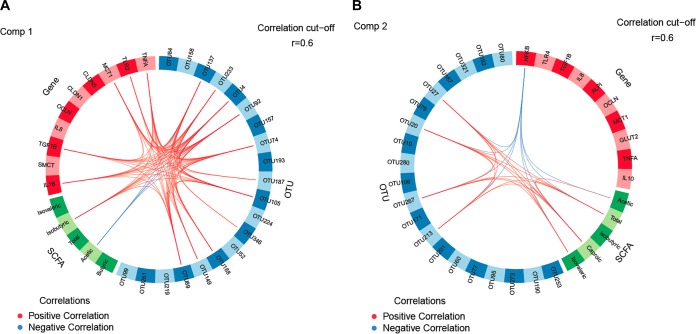
FIG 3.
Circos plots of horizontal sparse partial least-squares-discriminant analysis displaying correlations between the identified levels of the best discriminant operational taxonomic units (OTUs; n = 20) and short-chain fatty acids (SCFA, n = 5) and expression levels of target genes (n = 10) for (A) component 1 and (B) component 2 in the cecum. Positive and negative correlations (r > 0.6) are displayed by red and blue links, respectively. Relative abundance of bacterial OTUs = >0.01%.

