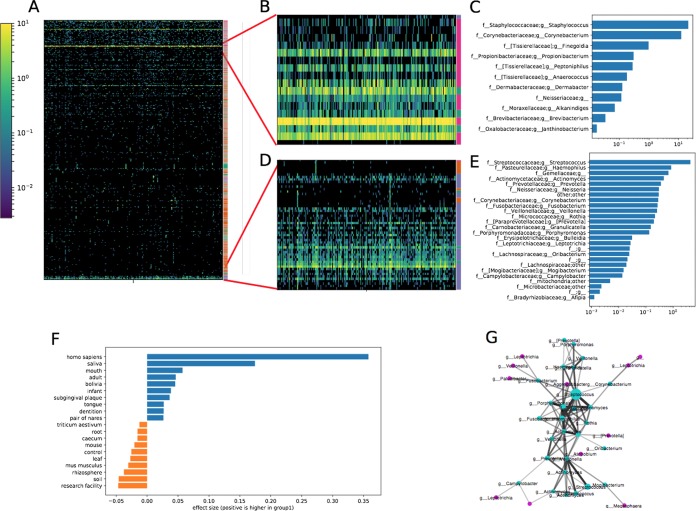
FIG 3.
Analysis of skin samples from reference 11. (A) All sOTUs in arm samples, with sOTUs clustered by abundance. (B) A zoomed-in view of panel A showing a cluster with a large number of skin-associated sOTUs. The vertical color bar on the right indicates the most common dbBact annotation out of skin (pink), saliva (blue), feces (green), or other (orange). (C) Taxonomies of the sOTUs in the cluster shown in panel B and their abundances (collapsed at the genus level). (D and E) Similar to panels B and C but showing a cluster with a number of saliva-associated bacteria and their taxonomies. (F) Enriched terms for the cluster shown in panel D compared to the rest of the sOTUs. Blue bars indicate terms significantly enriched in this cluster of bacteria, orange bars show terms enriched in the rest of the skin bacteria (dsFDR controlled at 0.1). (G) A cooccurrence network confirms the presence of the correlated sOTU cluster that is associated with saliva annotation term. The darkness and width indicate the correlation strength inferred by local similarity analysis (14, 15, 17). The size of the node represents the abundance of each sOTU. The sOTUs in the cluster shown in panel D are shown in cyan, and all the other sOTUs are shown in magenta.

