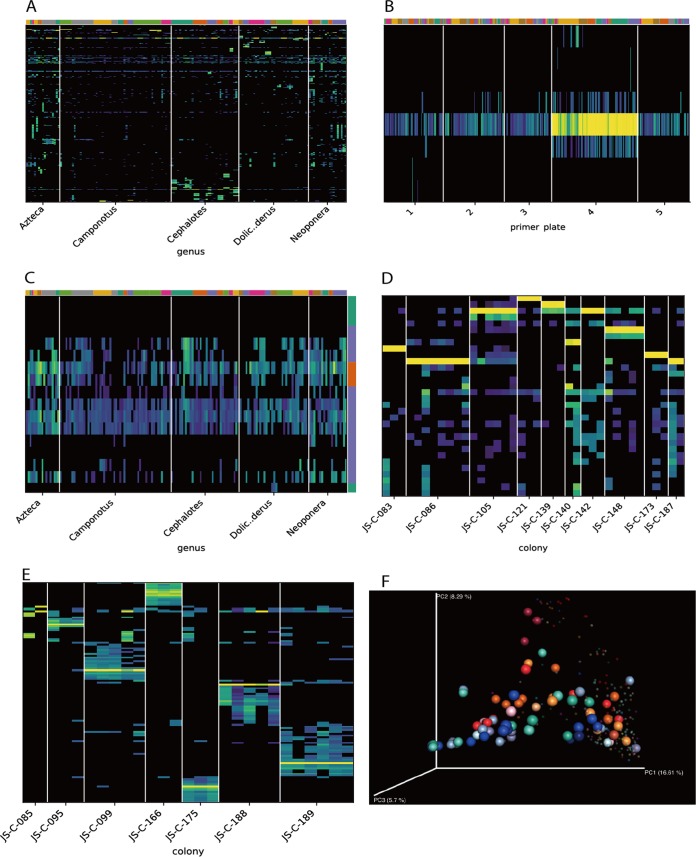
FIG 4.
Analyses of low-biomass ant gut microbiota. (A) Distribution of sOTUs across samples sorted by ant genus and colony. The top color bars indicate the ant colony of each sample. (B) A zoomed-in view showing the DNA extraction plate-dependent abundance profile of Acinetobacter johnsonii after the samples were sorted by plate. (C) A zoomed-in view of panel A showing a group of bacteria present in all samples across all ant genera. The color bar to the right indicates whether each sOTU is a known contaminant (orange) or has other annotations (blue) or no annotations (green) based on dbBact annotations. (D and E) Colony-specific abundance profiles of sOTUs within ant genera of Camponotus (D) and Dolichonderus (E) following filtering of contaminants and re normalization of the samples. Only sOTUs present in at least 10% of the samples are shown. (F) Unweighted UniFrac PCoA of all ant samples. Camponotus and Dolichoderus samples are colored by colony; all the other samples are in small and transparent spheres.

