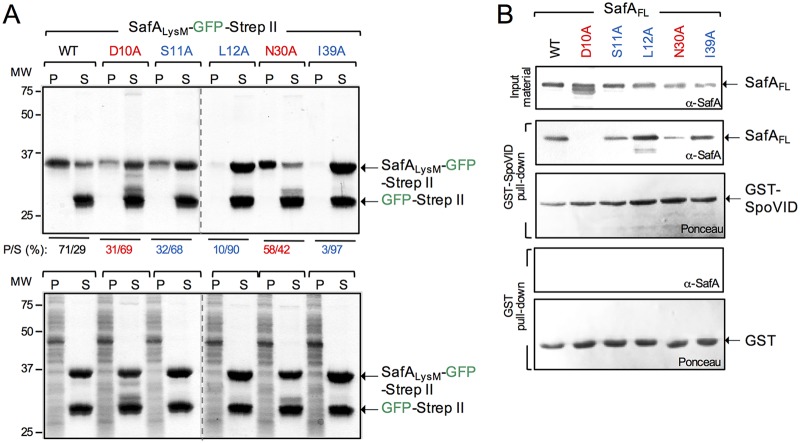
FIG 5.
Substitutions in the LysM domain impair its interaction with peptidoglycan or with SpoVID. (A) SafALysM-GFP-Strep-tag II proteins, WT, and variants with the indicated substitutions were purified along with GFP-Strep-tag II. The SafALysM proteins were mixed with GFP-Strep-tag II included to control for the tags, and with cortex peptidoglycan purified from WT spores. Following incubation, the suspensions were centrifuged and separated into a pellet (P, representing the binding fraction) and a supernatant (S, representing the nonbinding fraction). The gels were stained with Coomassie brilliant blue R-250, and the percentage of SafALysM-GFP-Strep-tag II in the P and S fractions was estimated with ImageJ (shown below the panel). The bottom is a control experiment in which the cortex PG was digested with lysozyme before the proteins were added. The arrows on the right show the position of SafALysM-GFP-Strep-tag II and GFP-Strep-tag II; the positions of molecular weight standards, in kilodaltons, are shown on the left side of the panel. (B) GST-SpoVID pulldown assay. Whole-cell extracts were prepared from E. coli strains producing the forms of SafA with the indicated single amino acid substitutions (color coded as in Fig. 2), GST, or GST-SpoVID. The extracts prepared from the strains producing the various forms of SafA were mixed with the GST-containing (two bottom panels) or GST-SpoVID-containing extracts (two middle panels). Following incubation, proteins were pulled with GST beads. Bound proteins were then eluted and resolved by SDS-PAGE, and the gel was subject to immunoblot analysis with an anti-SafAFL antibody. The membranes were stained with Ponceau red to control for the levels of GST or GST-SpoVID. The presence and levels of the various forms of SafA are shown at the top (input material). The arrows show the positions of SafA, GST, and GST-SpoVID. The positions of molecular weight standards (in kilodaltons) are shown on the left side of the panel.

