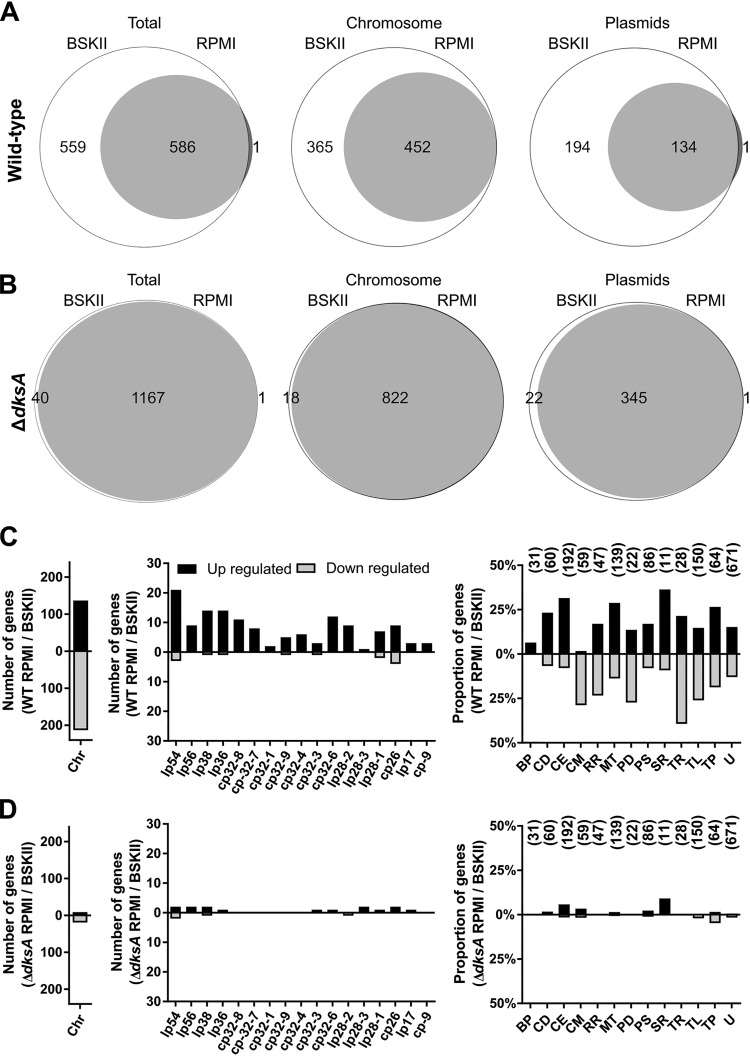
FIG 4.
DksA mediates transcriptional responses to starvation. (A and B) Venn diagram illustrates the number of genes expressed during mid-logarithmic-growth phase (BSK II medium) or during starvation (RPMI 1640 medium) by wild-type (WT) B. burgdorferi (A) or by the ΔdksA mutant strain (B). The data are represented as the total number of genes (left) or divided into number of chromosomal (Chr) or plasmid-carried genes. Genes expressed exclusively during mid-log phase or during starvation are represented outside the union of the two circles, whereas the genes expressed in both are represented within. (C and D) The number of differentially expressed genes by cultures of WT (C) and ΔdksA mutant (D) strains during starvation (RPMI 1640 medium) compared to mid-logarithmic-phase cultures (BSK II medium). Bars represent the number of genes differentially expressed on the chromosome (Chr), on the various plasmids, or the percentage of genes differentially expressed within the annotated functional categories relative to genes within the respective functional groups. The bars indicating proportions in the following categories: BP, bacteriophage; CD, cell division; CE, cell envelope; CM, chemotaxis and motility; RR, DNA replication and repair; MT, metabolism; PD, protein degradation; PS, pseudogene; SR, stress response; TR, transcription; TL, translation; TP, transporter proteins; and U, unknown. Numbers above the bars indicate the total number of genes within respective functional groups. Genes were considered differentially expressed if comparisons with FDR-adjusted P value of <0.05 and differential expression of 2-fold or more.

