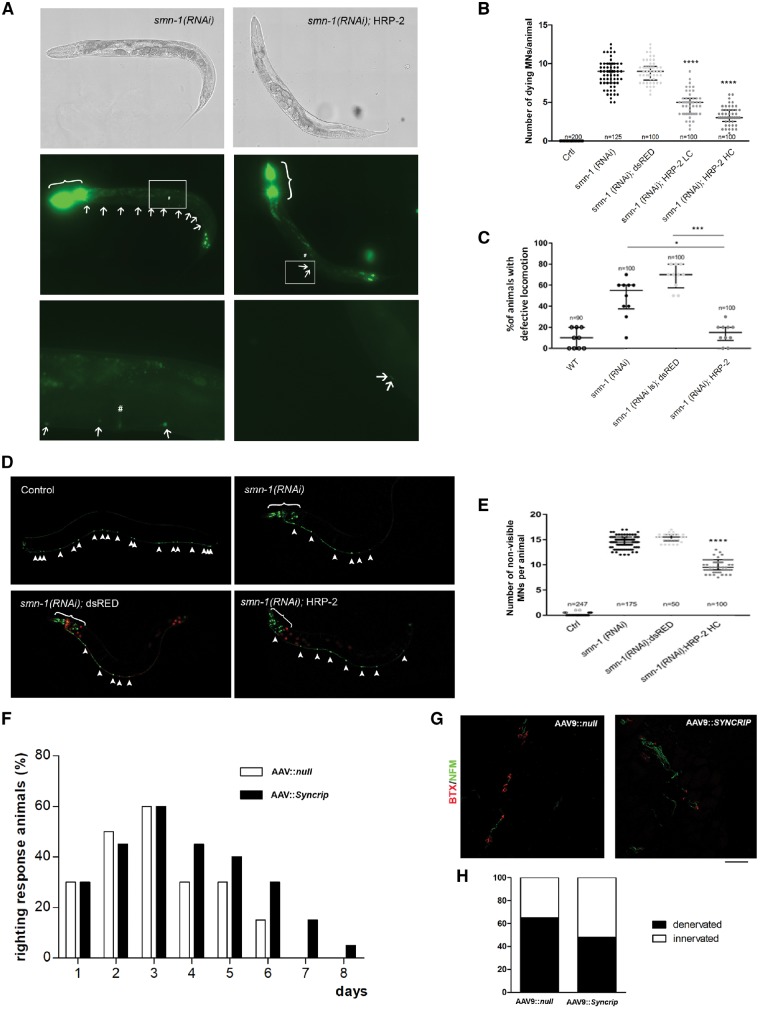
Figure 6.
SYNCRIP ameliorated the disease phenotype in in vivo models of SMA. (A–E) C. elegans; (F–H) mouse model. (A) Transgenic animals expressing HRP-2 in all neurons and silenced for smn-1 (right) present fewer dying neurons (arrows) than smn-1(RNAi) animals (left). In all panels, anterior is left and ventral is down. The animals were observed using brightfield (top) or epifluorescence (middle and bottom). The top and middle panels were reconstructed using the Tile Scan function of the Leica LAS X program. Middle: The co-injection marker was expressed in the pharynx and the nuclei of the most posterior intestinal cells (brackets). Bottom: Enlargements of the areas outlined in the middle panels around the vulva (#). (B) Quantification of dying motor neurons in non-silenced control (Ctrl), smn-1(RNAi), smn-1(RNAi) expressing dsRED (negative control), and HRP-2 at low (LC) and high (HC) concentrations. ****P < 0.0001 between smn-1(RNAi);HRP-2 LC and HC versus smn-1(RNAi) and smn-1(RNAi); dsRED (one-way ANOVA with Kruskal-Wallis test). Each dot represents the number of apoptotic fluorescently-labeled dying motor neurons in a single animal. The median with interquartile range is shown. n is the total number of animals observed from two independent transgenic lines. (C) Knock-down of smn-1 in D-type motor neurons leads to a locomotion defect not observed in wild-type (WT). This defect is rescued by HRP-2 but not by dsRED expression. *P = 0.0303, smn-1(RNAi);HRP-2 versus smn-1(RNAi) and ***P = 0.0001 smn-1(RNAi);HRP-2 versus smn-1(RNAi);dsRED (one-way ANOVA with Kruskal-Wallis test). Each dot represents the percentage of animals with a defective backward, among 10 animals tested. The median with interquartile range is shown. n is the total number of animals tested from at least two independent transgenic lines. (D) Transgenic animals expressing HRP-2 in all neurons and silenced for smn-1 (bottom right) present more visible/viable neurons labelled with GFP (arrowheads) than smn-1(RNAi) (top right) or smn-1(RNAi);dsRED animals (bottom left). All 19 motor neurons are visible in the ventral cord in control animals (top left). Motor neurons are visible because of the expression of GFP in the ventral cord, transgene oxIs12[punc-47::GFP]. Additional cells express GFP in the head because of the expression of the pchs-2::GFP co-injection marker (brackets, top right and bottom). Red fluorescence is visible in all neurons in dsRED animals (bottom left) or in the intestinal nuclei because of pelt-2::RFP co-injection marker (bottom right). (E) Quantification of the percentage of degenerating neurons in wild-type (Ctrl), smn-1(RNAi), and smn-1(RNAi) expressing dsRed or hrp-2. The smn-1 knock-down induced the degeneration of motor neurons, and this defect was partially rescued by HRP-2 expression. ****P < 0.0001 smn-1(RNAi);HRP-2 versus smn-1(RNAi) and smn-1(RNAi); dsRED (one-way ANOVA with Kruskal-Wallis test). Each dot represents the number of degenerated motor neurons in a single animal, among 19 that are visible in the wild-type. The median with interquartile range is shown. n is the total number of animals observed from two independent transgenic lines. (F) The righting reflex was significantly improved in SMAΔ mice injected ICV at P1 with AAV9::Syncrip compared to AAV9::null SMA mice beginning on Day 4. Notably, after P6, no AAV9::null SMA mice were able to right, whereas a percentage of SMA mice overexpressing Syncrip maintained the righting reflex function. **P < 0.01, contingency chi-squared test (χ2 = 23.76), n = 5 mice/group. (G and H) Quantification of presynaptic NF-M (green) and postsynaptic α-bungarotoxin (red) signal in intercostal muscles showed a significant increase in NMJ innervation in AAV9::Syncrip SMA mice compared to AAV9::null SMA mice. *P < 0.05, contingency chi-squared test (χ2 = 5.879), n = 100 NMJs analysed for each animal, three mice/group.

