
Figure 3.
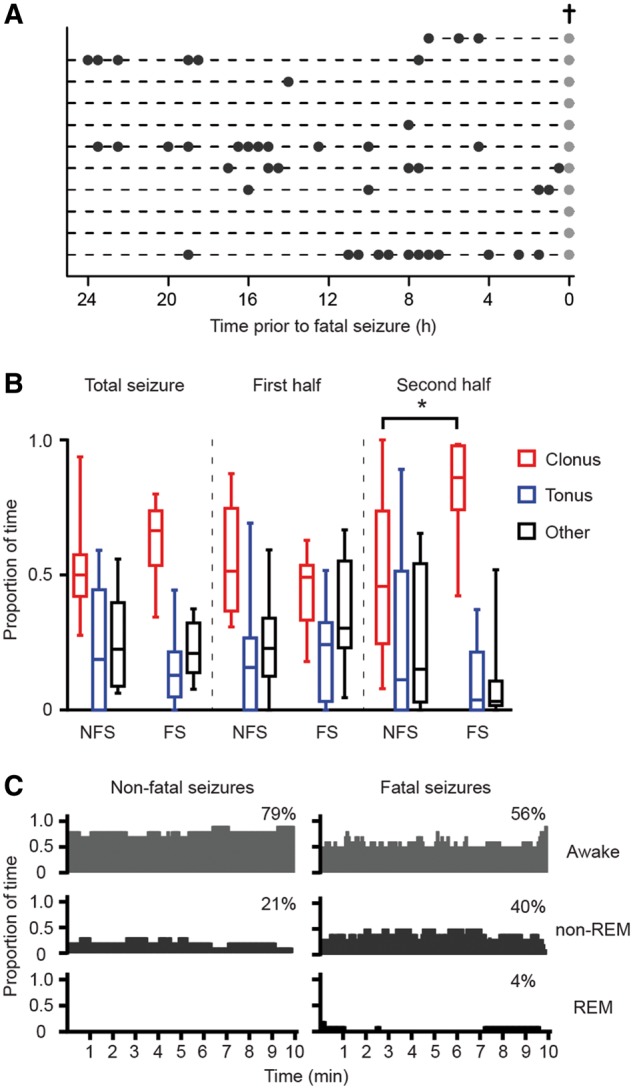
Frequency of spontaneous non-fatal and fatal seizures (stage 5) and (pre-)ictal behaviour in implanted homozygous Cacna1aS218L mice. (A) The distribution of non-fatal seizures (black dots) in implanted mice over the 24 h preceding the fatal seizure (grey dots; cross). (B) Fatal seizures were associated with a proportional increase of clonic behaviour during the second half of the seizure at the cost of tonic and other behaviours, when compared to non-fatal seizures (n = 11 per group; *P = 0.001; data are shown as median, interquartile intervals, minimum and maximum). (C) Vigilance state preceding non-fatal and fatal seizures (percentages indicate fraction of total time) was not significantly different (P > 0.99). FS = fatal seizures; NFS = non-fatal seizures.