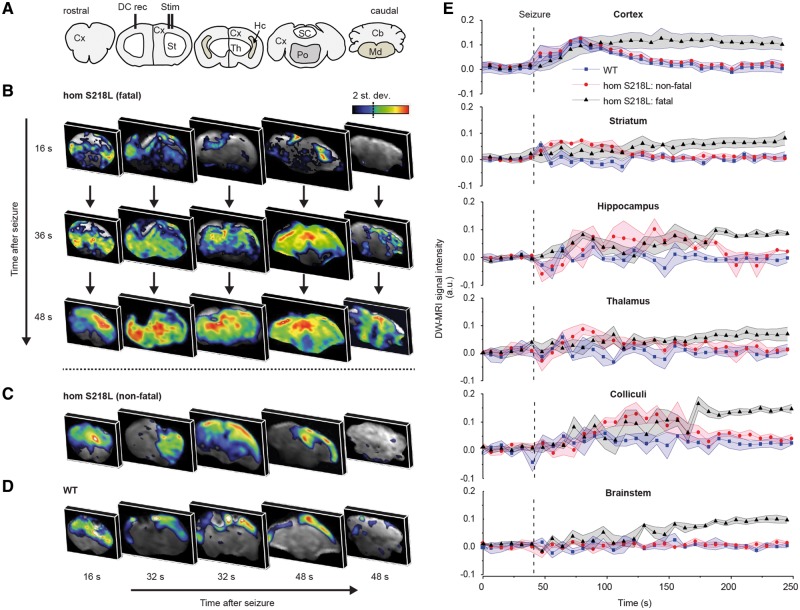
Figure 6.
DW-MRI visualization of spreading depolarization following induced seizures in anaesthetized homozygous Cacna1aS218L mice. (A) Coronal brain maps corresponding to DW-MRI images in B–D. (B) Representative DW-MRI data following an induced fatal and (C) non-fatal seizure in a homozygous Cacna1aS218L (hom S218L) mouse, and (D) a non-fatal seizure in a wild-type (WT) mouse. Data are shown for a single representative time point in each slice, capturing a snapshot of spreading depolarization (SD). Note that in B, all coronal maps are shown at three time points to demonstrate spatiotemporal propagation of spreading depolarization, whereas in C and D different sections at three time points are depicted to show the limited subcortical spread of spreading depolarization in non-fatal seizures. (E) Time course data of wild-type mice (n = 3; seven spreading depolarizations) and Cacna1aS218L mice (n = 7; 13 non-fatal spreading depolarizations; four fatal spreading depolarizations) in relation to seizure onset (dashed line) are shown for distinct brain regions obtained from DW-MRI data. In Cacna1aS218L mice, spreading depolarization appeared in the brainstem only during fatal seizures and was constrained to striatum, amygdala, hippocampus and colliculi during non-fatal seizures. Cortical spreading depolarization occurred in all wild-type and Cacna1aS218L mice. A.u. = arbitrary units; Cb = cerebellum; Cx = cortex; DC = direct current; Hc = hippocampus; Md = medulla oblongata; Po = pons; SC = superior colliculus; St = striatum; Th = thalamus.

