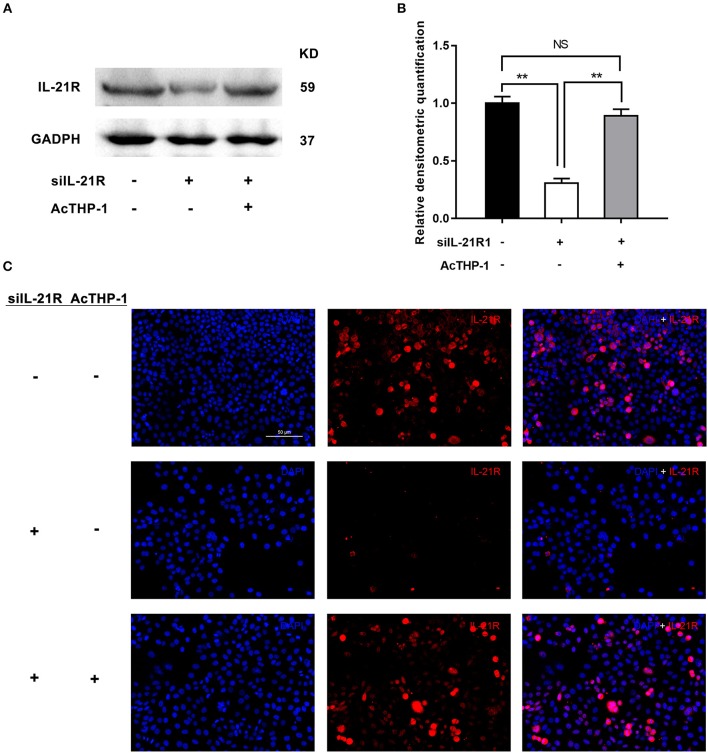
Figure 6.
Effect of AcTHP-1 co-culture on the expression of IL-21R in BPH-1 cells. (A) Representative Western Blot bands of IL-21R in BPH-1 cells co-cultured with or without AcTHP-1 in the absence or presence of siIL-21R1. (B) Relative densitometric quantification of IL-21R in BPH-1 cells. GAPDH expression was analyzed as a loading control, results are expressed as ratio of the proteins in respect to GAPDH. Boxes, mean; bars, ± SD; **P < 0.01 vs. BPH-1cells without AcTHP-1 co-culture in the presence of siIL-21R1. NS means no significance, BPH-1 cells without AcTHP-1 co-culture in the absence of siIL-21R1 vs. BPH-1cells with AcTHP-1 co-culture in the presence of siIL-21R1. (C) Immunofluorescence of IL-21R in BPH-1 cells. Cy3-immunofluorescence (red) indicates IL-21R expression. DAPI (blue) indicates cell nuclear staining. Merged image indicates of IL-21R and DAPI. Upper, BPH-1cells without AcTHP-1 co-culture in the absence of siIL-21R1. Middle, BPH-1cells without AcTHP-1 co-culture in the presence of siIL-21R1. Lower, BPH-1cells with AcTHP-1 co-culture in the presence of siIL-21R1. The scale bars are 50 μm.

