Figure 9.
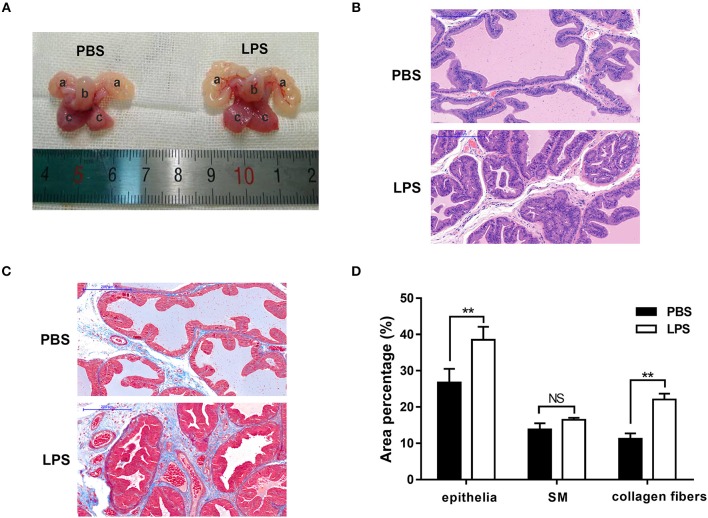
Typical rat prostate photograph and histological examination. (A) typical prostate photograph from PBS and LPS treatment rats, (a) seminal vesicle, (b) bladder, (c) prostate. (B) Representative H-E staining of PBS and LPS treatment rat prostate. The scale bars are 200 μm. (C) Masson's trichrome staining of PBS and LPS treatment rat prostate, prostate epithelial cells were stained orange, SM cells were stained red and collagen fibers were stained blue. The scale bars are 200 μm. (n = 8 for each group). (D) Quantification of Masson's trichrome staining. Area percentage of different component were quantified from three random 100 × fields of each tissue slices (n = 8 for each group). Boxes, mean; bars, ± SD; **P < 0.01, NS means no significance vs. PBS.

