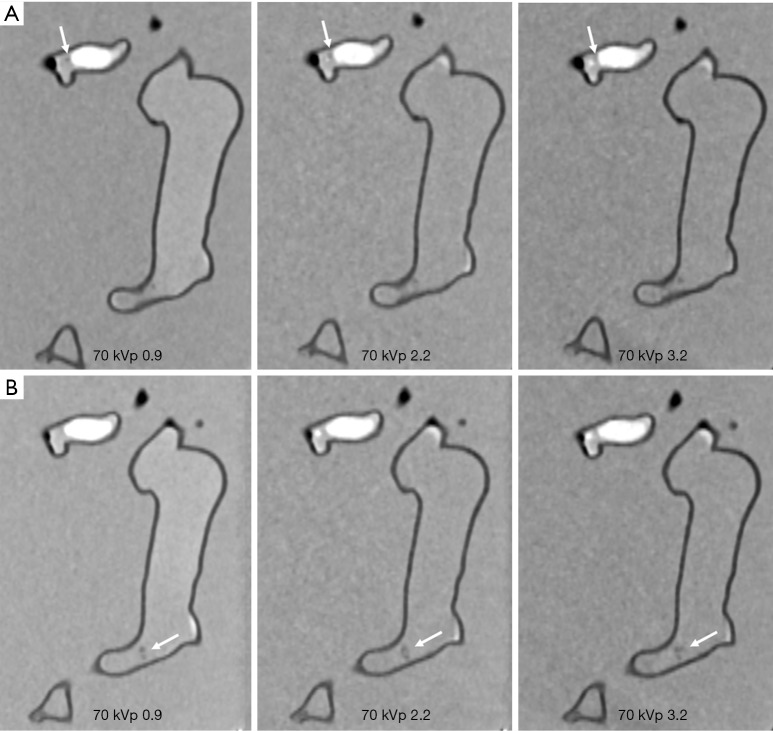
Figure 4.
CTPA protocols with use of 70 kVp and different pitch values. (A) Visualization of small thrombus in the left segmental pulmonary artery with low-attenuation filling defect (arrows). Thrombus was more clearly visualized in pitch 0.9 and 2.2 protocols when compared to the high pitch 3.2 protocol. (B) Visualization of small thrombus in the distal part of right main pulmonary artery with filling defect (arrows) detected in all of the protocols. CTPA, computed tomography pulmonary angiography.

