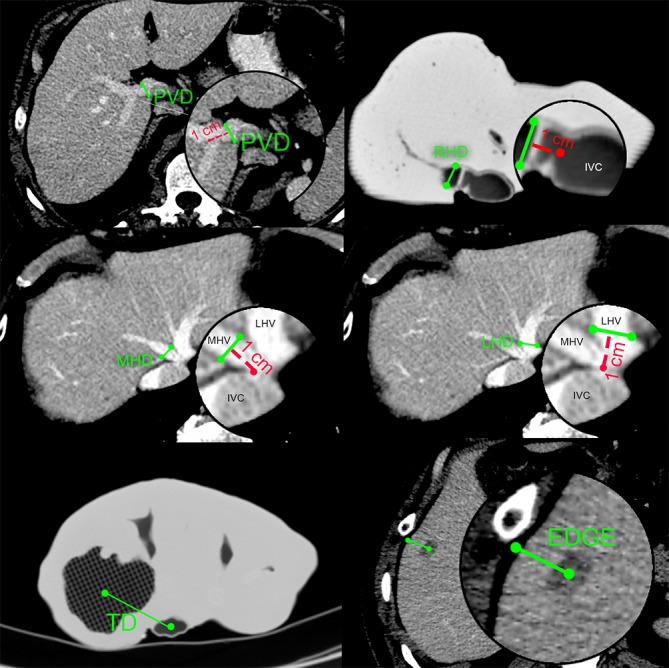
Figure 4.

Schematic representation of 2D landmark measurements performed on axial CT images. PVD, MHD, LHD and EDGE measurements are shown on example of PCT images, while TD and RHD on example of MCT images. PVD, portal vein diameter; MHD, middle hepatic vein diameter; LHD, left hepatic vein diameter; TD, distance from tumor to IVC; EDGE, distance from tumor to liver edge; RHD, right hepatic vein diameter; CT, computed tomography; PCT, patient CT; MCT, model CT.
