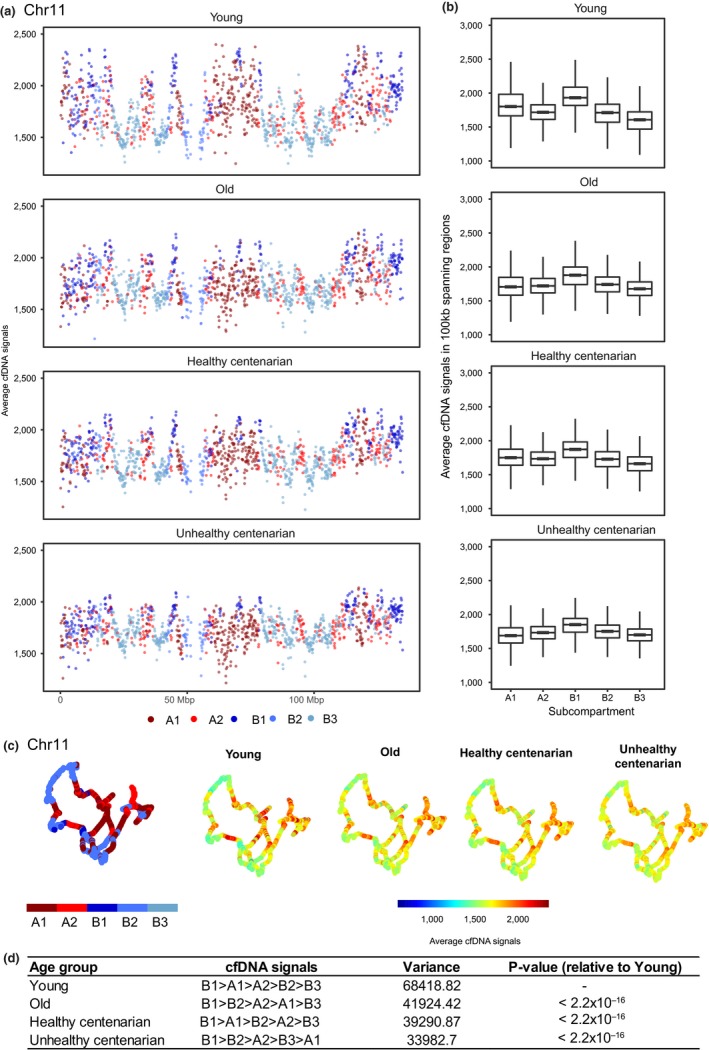
Figure 2.

Cell‐free DNA (cfDNA) signals in different subcompartments. (a) Average cfDNA signals of 100‐kb regions spanning across chr 11 in each age group. Colors represent the subcompartment that these 100‐kb spanning regions are in based on GM12878 Hi‐C data. The 3D organization of chr 11 at 100 kb resolution were colored by either the subcompartments or the average cfDNA signals. (b) Boxplots showing the average cfDNA signals in 100‐kb spanning regions in all chromosomes across subcompartments. The top and bottom bounds of the boxplot correspond to the 75th and 25th percentiles, respectively. (c) The 3D organization of chr 11 at 100 kb resolution, colored by the average cfDNA signals or the subcompartment regions. (d) Quantitation of cfDNA signals in all chromosomes across subcompartments (p < 0.005; one‐way ANOVA and Tukey's test)
