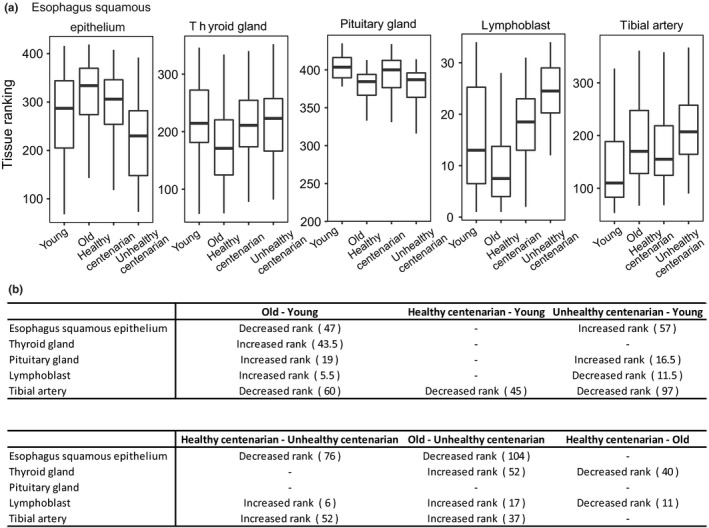
Figure 6.

Cell‐free DNA origin changes with age. (a) Boxplots showing tissues that showed significant rank changes between age groups. The top and bottom bounds of the boxplot correspond to the 75th and 25th percentiles, respectively. (b) Significant change in ranking is shown in the table, with the magnitude of tissue ranking change indicated by numbers in parentheses (p‐value < 0.05, Kruskal–Wallis test and post hoc Dunn's test)
