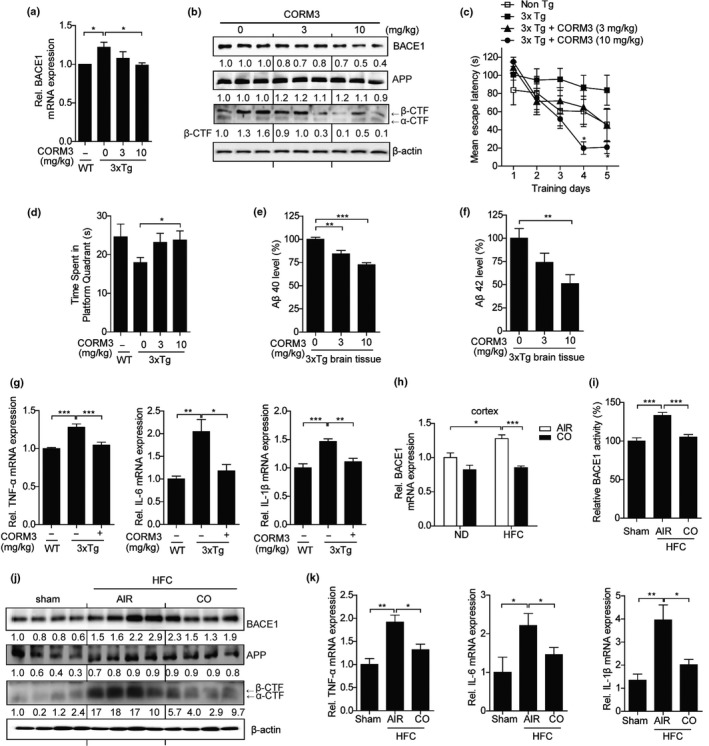
Figure 1.

CO reduces cortical BACE1 expression in 3xTg and HFC diet mice. (a–g) Wild‐type (Non‐Tg) or 3xTg‐AD mice were intraperitoneally injected daily for 1 month with CORM3 (3 or 10 mg/kg) or a vehicle solution and subjected to the Morris water maze test. (a) The expression of BACE1 in CORM3‐treated 3xTg‐AD and Non‐Tg brains was determined by qRT–PCR. Data were represented as mean ± SEM four technical replicates, *p < 0.05. (b) Protein levels in CORM3 administrated 3xTg‐AD and non‐transgenic mouse brains were measured by immunoblotting with anti‐BACE1 antibody, and anti‐APP antibody (A8717) for detecting full‐length APP and CTFs. β‐actin was used as an internal control. N = two independent experiments. (c) Morris water maze test was performed to analyze the effect of CO on impairment of learning and memory in 3xTg‐AD mice as indicated by reduced performance to find the hidden platform (non‐Tg with vehicle, n = 5; 3xTg‐AD with vehicle, n = 7; 3xTg‐AD with CORM 3 mg/kg, n = 5; 3xTg‐AD with CORM 10 mg/kg, n = 4). Data were shown as mean ± SEM. *p < 0.05. (d) Probe test was performed on the last day after 5 days of training phase. Data were shown as mean ± SEM of three independent experiments. *p < 0.05. (e, f) Aβ40 and Aβ42 in the whole brain lysates were measured by ELISA. (g) The gene expression of TNF‐α, IL‐6, and IL‐1β were determined by quantitative RT–PCR. Data were represented as mean ± SEM from four technical replicates, *p < 0.05, **p < 0.01. ***p < 0.001. (h–k) HFC or control chow diets fed mice were inhaled with air or CO. (h) Cortical BACE1 mRNA levels were determined by qRT–PCR. Data were represented as mean ± SEM from four technical replicates, *p < 0.05, ***p < 0.001. (i) BACE1 activity was evaluated using brain lysates by a fluorescent‐based β‐secretase activity assay kit. (j) Cortical proteins were analyzed by immunoblotting with anti‐BACE1 antibody, and anti‐APP antibody (A8717) for detecting full‐length APP and CTFs. β‐actin was used as an internal control. N = two independent experiments. (k) The gene expression of TNF‐α, IL‐6, and IL‐1β were determined by quantitative RT–PCR. Data were represented as mean ± SEM three technical replicates. *p < 0.05, **p < 0.01. All results are determined by one‐way or two‐way analysis of variance (ANOVA) followed by Bonferroni post hoc test and are representative of two independent experiments
