
Figure 3.
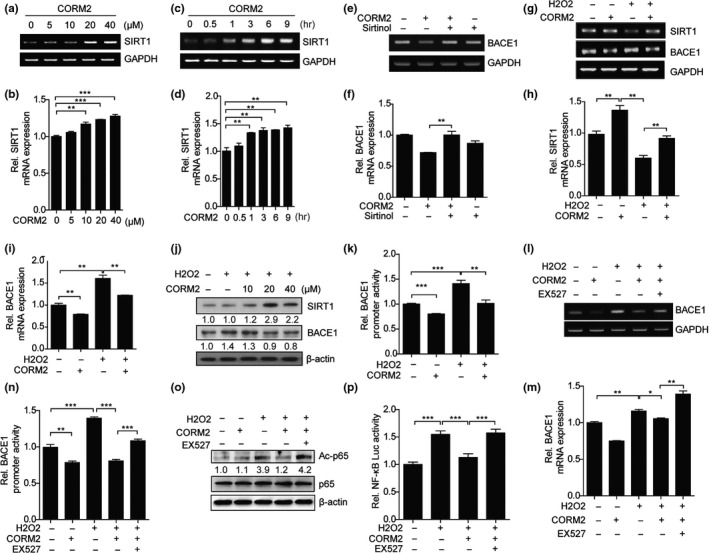
CO‐induced SIRT1 reduces oxidative stress‐induced BACE1 expression through negative regulation of NF‐κB transcriptional activity. (a–d) SH‐SY5Y cells were treated with CORM2 at the indicated doses for 6 hr (a, b) and 20 μM CORM2 for the indicated times (c, d). SIRT1 mRNA levels were examined by semiquantitative RT–PCR (a, c) and qRT–PCR (b, d). Data were represented as mean ± SEM from three technical replicates, **p < 0.01, ***p < 0.001, via one‐way ANOVA followed by Tukey's test. Results are representative of three independent experiments. (e, f) SH‐SY5Y cells were pre‐incubated with 400 μM sirtinol for 24 hr and treated with 20 μM of CORM2 for 6 hr. The levels of BACE1 mRNA expression were determined by semiquantitative RT–PCR (e) and qRT–PCR (f). (g–i) SH‐SY5Y cells were pretreated with CORM2 and incubated with 200 μM of H2O2 for 3 hr. The mRNA levels of SIRT1 and BACE1 were measured by semiquantitative RT–PCR (g) and qRT–PCR (h, i). (j) SH‐SY5Y cells were incubated with 200 μM of H2O2 for 3 hr in the presence of CORM2 at the indicated doses. The protein levels of SIRT1 and BACE1 were performed by immunoblotting. N = three independent experiments. (k) SH‐SY5Y cells were co‐transfected with BACE1P‐2.5 constructs or pGL3 basic vector and pRL‐SV40 plasmid for 24 hr, and then, cells were treated with H2O2 (200 μM) in the presence of CORM2 at the indicated doses. After 12 hr, luciferase activity was measured. (l, m) SH‐SY5Y cells were pretreated with or without the SIRT1 inhibitor (EX527; 40 μM) for 1 hr, followed by treatment with CORM2 (20 μM) alone or in combination for 1 hr and harvest after incubating with H2O2 (200 μM) for 6 hr. The levels of BACE1 mRNA expression were determined by semiquantitative RT–PCR (l) and qRT–PCR (m). (n) BACE1P‐2.5 and pRL‐SV40 plasmid were co‐transfected into SH‐SY5Y cells, and then, cells were treated with H2O2 (200 μM) in the presence of CORM2 (20 μM) and EX527 (40 μM). After 12 hr, luciferase activity was measured. (o) SH‐SY5Y cells were pretreated with or without the SIRT1 inhibitor (EX527; 40 μM) for 1 hr, followed by treatment with CORM2 (20 μM) alone or in combination for 1 hr and harvest after incubating with H2O2 (200 μM) for 1 hr. The protein levels of Ac‐p65 and p65 were measured by immunoblotting. N = three independent experiments. (p) SH‐SY5Y cells were transfected with NF‐κB responsive element reporter constructs (NF‐κB‐Luc) and pRL‐SV40 plasmid for 48 hr. Cells were pretreated with CORM2 and stimulated with 200 μM of H2O2. After 6 hr, luciferase activity was measured. Data (f, h, i, k, n, p, m) were represented as mean ± SEM from three technical replicates, *p < 0.05, **p < 0.01, ***p < 0.001 via two‐tailed Student's t test. Results are representative of three independent experiments