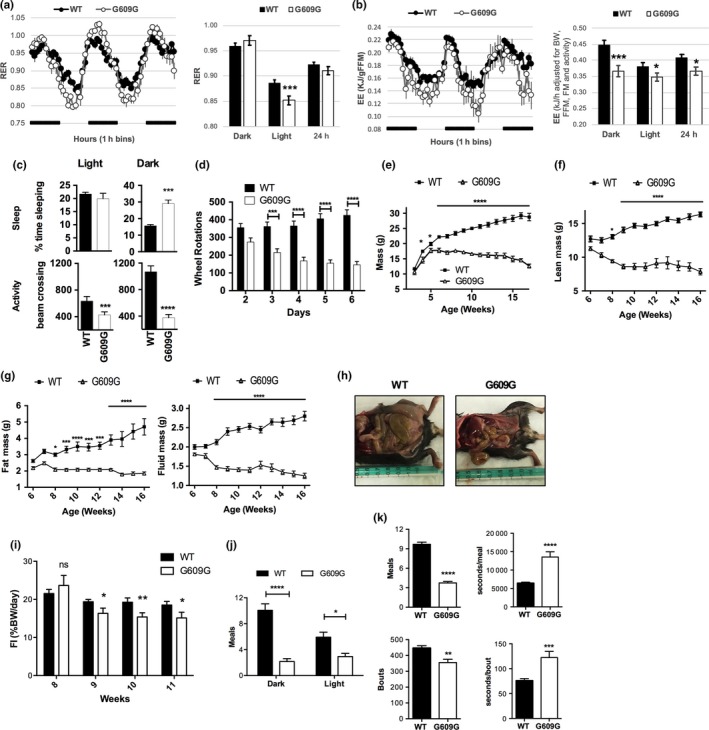
Figure 1.

Characterization of metabolism of G609G mice. Comprehensive lab animal monitoring system (CLAMS) was utilized to compare whole body fuel selection, indicated by the respiratory exchange ratio (RER), and energy expenditure between WT and G609G mice at 7 weeks of age (all males). (a) RER was measured every hour for a period of 60 hr in 6 WT mice and 5 G609G mice. Left graph shows raw data in 1‐hr bins, with the dark phase indicated by a black bar. Right graph shows averaged values during light and dark phases, and over 24 hr (right panel). Total number of values averaged: 144 for WT and 120 for G609G mice. RER in WT and G609G mice is significantly different during the lights‐on phase (***p < 0.005). (b) Energy expenditure (EE) in the same mice as in (a). EE is significantly lower in G609G mice compared to WT when adjusted for body mass/composition and physical activity. Left graph shows raw data adjusted for lean mass as 1‐hr bins, with the dark phase indicated by a black bar. Right graph shows the results from an EE analysis using ANCOVA where body weight, body composition –FM (fat mass), FFM (fat‐free mass)‐ and physical activity were included as covariates. An analysis using linear regression indicates body weight, FFM and activity are significant predictors in the model for EE over 24 hr. Total number of values averaged: 144 for WT and 120 for G609G mice. (c) Monitoring of activity and sleep in the same mice as in (a) during the light and dark cycles. (d) Locomotor activity was recorded daily using 7‐week old mice housed in cages with free access to running wheels. N = 11 mice per group. (e) Graph shows mass recorded daily for male mice. G609G mice have reduced mass, with a slower rate of gain and lower plateau than WT mice. N = 12 mice per group. (f,g) Body mass composition of male WT and G609G mice from 6 to 16 weeks of age. N = 10 for each group. (h) Necropsy pictures of 11 weeks‐old male mice. Notice the reduction in abdominal/subcutaneous fat in G609G mice. (i) Food intake (% body weight ingested per day per mouse) calculated daily in single‐housed WT (N = 10) and G609G (N = 9) mice fed RC diet since weaning. Measurements performed from weeks 8 to 11 of age. (j) Eating behavior as number of meals in the dark and light cycles of WT (n = 14) and G609G (n = 7) male mice. Recording was performed during 5 days using BiodaQ 2.3 system. (k) Monitoring of total number of meals and bouts (left graphs), and time (seconds) spend per meal/bout over the 5‐days period. In all figures, * denotes p value of statistical significance (*p < 0.05; **p < 0.01; ***p < 0.005; ****p < 0.0001), and error bars represent standard error of the mean (SEM)
