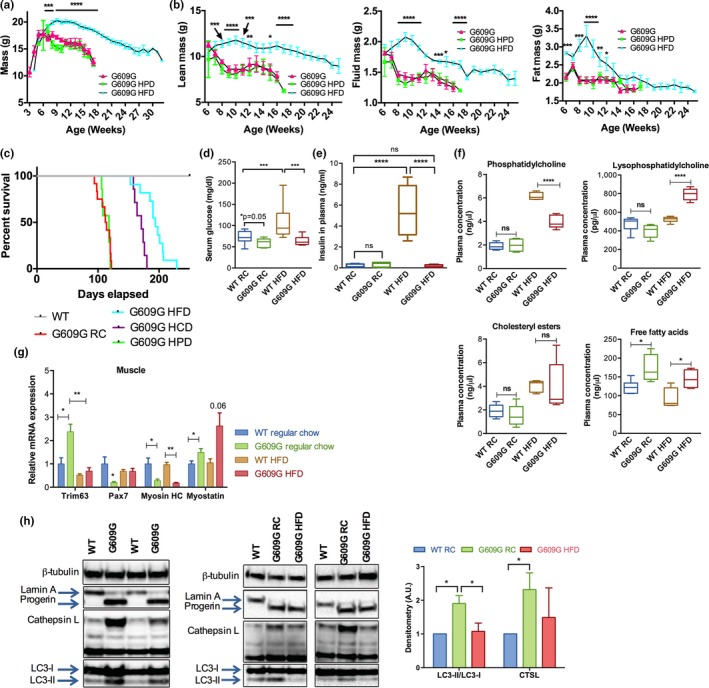
Figure 3.

Delayed aging phenotypes and extended lifespan of G609G mice fed HFD. (a) Mass was recorded daily for male G609G mice fed RC (N = 12), HFD (N = 11), or high‐protein diet (HPD; N = 7) since weaning. Note the sustained increase in body mass of G609G mice on HFD. (b) Lean, fluid, and fat mass composition as measured by NMR in male G609G mice fed RC, HFD or HPD from 6 to 25 weeks of age. (c) Kaplan–Meier survival curves of male WT and G609G mice fed RC (N = 12), HFD (N = 11), HPD (N = 7), and HCD (N = 7; a diet consisting of 40% fat content + cholesterol). (d) Blood glucose monitored for groups of mice fed RC or HFD since weaning and fasted for 6 hours: WT RC (N = 13), G609G RC (N = 12), WT HFD (N = 7), and G609G HFD (N = 10). Analysis at 11 weeks of age. (e) Insulin levels measured for WT and G609G mice fed RC (~11 weeks of age) or HFD (~22 weeks of age): WT RC (N = 9), G609G RC (N = 7), WT HFD (N = 8), G609G HFD (N = 4). Mice were fasted for 3 hours prior to collecting blood for analyses. WT mice develop hyperglycemia and hyperinsulinemia on HFD, while G609G mice do not. (f) Concentrations of phosphatidylcholines, lysophosphatidylcholines, cholesteryl esters, and free fatty acids as determined by mass spectrometry. Female G609G and WT mice were used for this study. Mice were either fed RC since weaning or switched from RC to HFD at 11 weeks of age for four weeks (as in Figure 2a). Samples were collected at 11 weeks of age in mice on RC and at 14 weeks of age in mice switched to HFD. N = 5 in each group. (g) qRT‐PCR analysis on muscle samples (quadriceps) from WT (N = 6) or G609G (N = 4) mice fed RC (11 weeks of age) or HFD (22 weeks of age). (h) Immunoblotting on proteins isolated from WT or G609G mouse quadriceps at necropsy. Notice expression of progerin and increased expression of CTSL and LC3‐II in G609G mice (left panel), which are ameliorated on HFD (right panels). Graph shows densitometry of immunoblots (average ± SEM) performed in WT (n = 6) and G609G (N = 6) mice fed RC (11 weeks old) and G609G fed HFD (N = 4 and 22 weeks old) mice. Note the increase in LC3‐II/LC3‐I ratio and CTSL levels in G609G mice fed RC, and the decrease in G609G mice fed HFD
