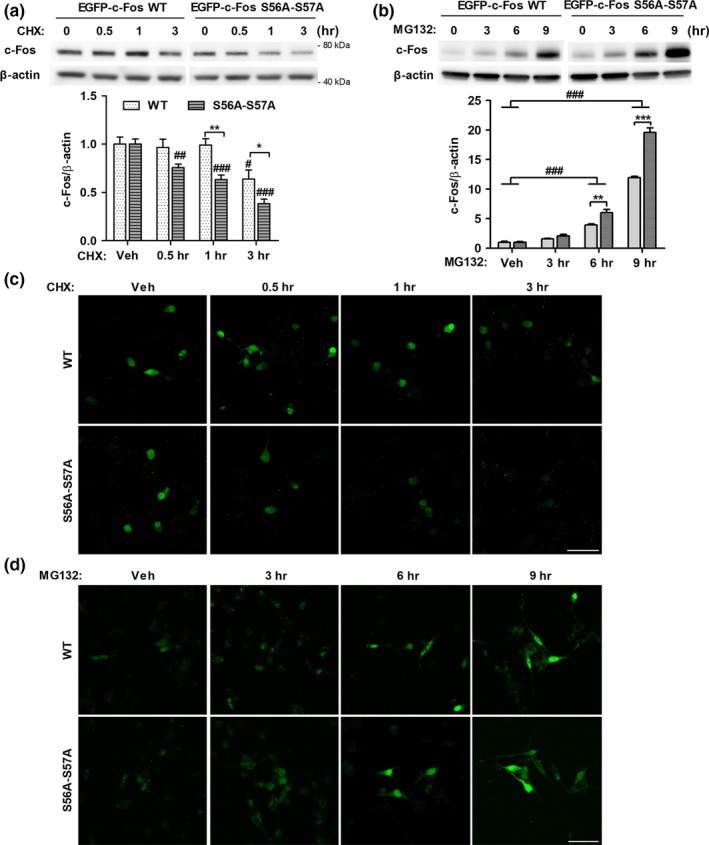
Figure 5.

O‐GlcNAcylation of c‐Fos at S56 and S57 increases c‐Fos stability. (a, c) EGFP‐c‐Fos‐WT or EGFP‐c‐Fos‐S56A‐S57A transfected SH‐SY5Y were treated with cycloheximide (30 μg/mL) for indicated times. Representative immunoblot images and quantitative graph are shown in the upper panel and lower panel, respectively (a) (n = 4). Representative confocal images of EGFP signals are presented in (c). (b, d) EGFP‐c‐Fos‐WT or EGFP‐c‐Fos‐S56A‐S57A transfected SH‐SY5Y were treated with MG132 (5 μM) for indicated times. Representative immunoblot images and quantitative graph are shown in the upper panel and lower panel, respectively (b) (n = 5). Representative confocal images of EGFP signals are presented in (d). Data are shown as mean ± SEM. # p < 0.05, ## p < 0.01, ### p < 0.001 among EGFP‐c‐Fos‐WT or EGFP‐c‐Fos‐S56A‐S57A transfected group (one‐way ANOVA, Bonferroni posthoc test), *p < 0.05, **p < 0.01, ***p < 0.001 between EGFP‐c‐Fos‐WT and EGFP‐c‐Fos‐S56A‐S57A group (two‐way ANOVA, Bonferroni posthoc test). CHX: cycloheximide; S56A‐S57A: EGFP‐c‐Fos‐S56A‐S57A. Scale bar: 50 μm
