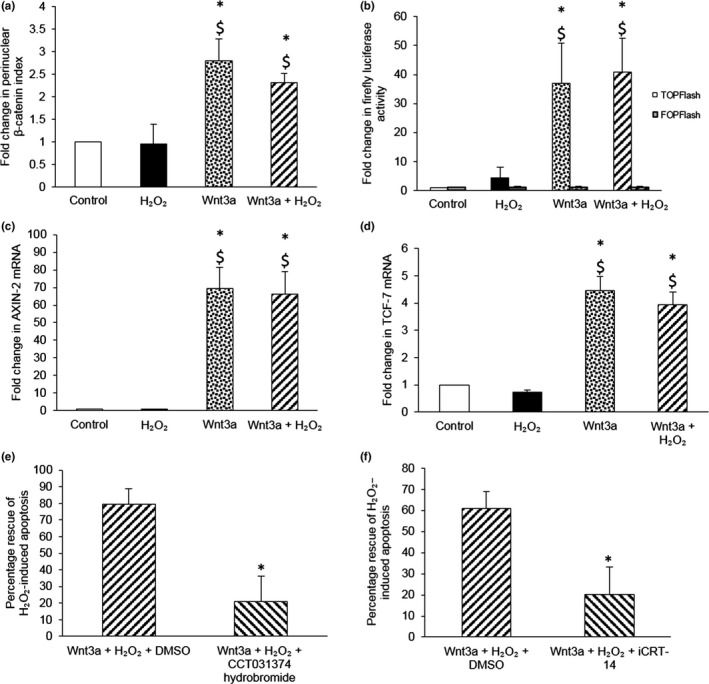
Figure 2.

Wnt3a‐mediated rescue of VSMCs from H2O2‐induced apoptosis requires β‐catenin/TCF signalling. (a) Nuclear translocation of β‐catenin was quantified in young TOPGAL mouse VSMCs stimulated with 100 μM H2O2, with or without 400 ng/ml recombinant Wnt3a protein, for 30 min by immunofluorescence. The number of cells with β‐catenin nuclear translocation, defined as perinuclear β‐catenin staining, was counted and expressed as a percentage of the total number of cells viewed. The fold change in the percentage of cells with perinuclear β‐catenin vs. control was then calculated and referred to as the fold change in perinuclear β‐catenin index. Error bars represent SEM. *p < 0.05 vs. control, $p < 0.05 vs. H2O2, ANOVA and Student–Newman–Keuls post hoc test, n = 4. (b) Firefly luciferase activity was quantified in young TOPGAL mouse VSMCs transfected with TOPFlash or FOPFlash plasmids (negative control) and stimulated with 100 μM H2O2, with or without 400 ng/ml recombinant Wnt3a protein, for 24 hr. Renilla luciferase plasmids were used to normalize for transfection efficacy, prior to normalization by protein concentration. Results are shown as the fold change from control. Error bars represent SEM. *p < 0.05 vs. control, $p < 0.05 vs. H2O2, ANOVA and Student–Newman–Keuls post hoc test, n = 6. (c, d) AXIN‐2 (c) or TCF‐7 mRNA (d) was quantified by QPCR in young TOPGAL mouse VSMCs stimulated with 100 μM H2O2, with or without 400 ng/ml recombinant Wnt3a protein, for 4 hr. mRNA levels were normalized to 36B4 mRNA. Results are shown as the fold change from control. Error bars represent SEM. *p < 0.05 vs. control, $p < 0.05 vs. H2O2, ANOVA and Student–Newman–Keuls post hoc test, n = 3. (e, f) Apoptosis was quantified in young TOPGAL mouse VSMCs stimulated with 100 μM H2O2, with or without 400 ng/ml recombinant Wnt3a protein and either 1 μM CCT031374 hydrobromide (e) or 25 μM iCRT14 (f), for 24 hr using CC3 immunofluorescence. DMSO was used as a vehicle control. The number of CC3 positive cells was counted and expressed as a percentage of the total number of cells viewed. The percentage rescue from H2O2‐induced death was then calculated. Error bars represent SEM. *p < 0.05 vs. the percentage rescue by Wnt3a protein in the presence of DMSO, unpaired Student’s t test, n = 4 for (e) and n = 5 for (f)
