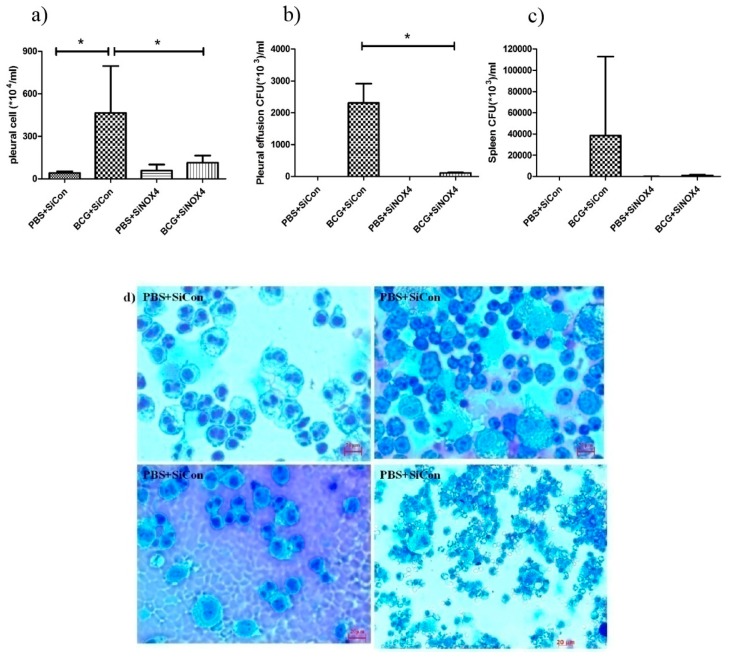
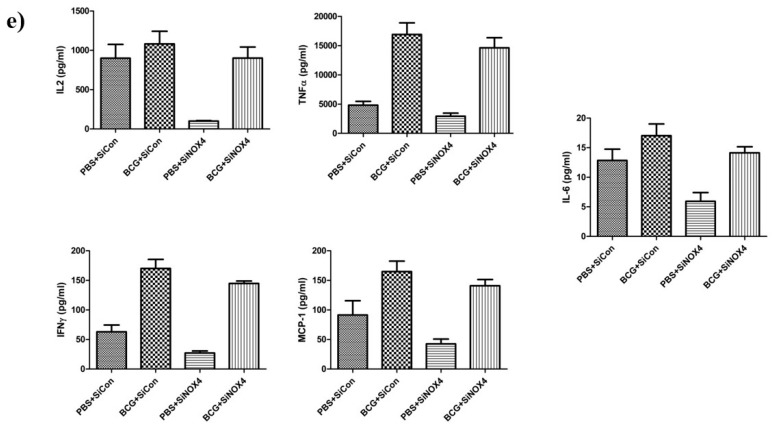
Figure 8.
BCG-induced pleurisy and accumulation of cells in the pleural cavity. (a) Total number of cells in the pleural cavities in four groups (PBS + SiCon group, BCG + SiCon group, PBS + SiNOX4 group, and BCG + SiNOX4 group) Seven mice per group were analyzed. (b) Bacterial load in pleural effusion in four groups. (c) Bacterial load in spleen in four groups. (d) Photomicrographs from cytospin stained with Giemsa. (e) Cytokine levels (Interferon-ɤ, IL-2 TNF-α, MCP-1, and IL-6) were assessed in the pleural fluid. * p < 0.05.


