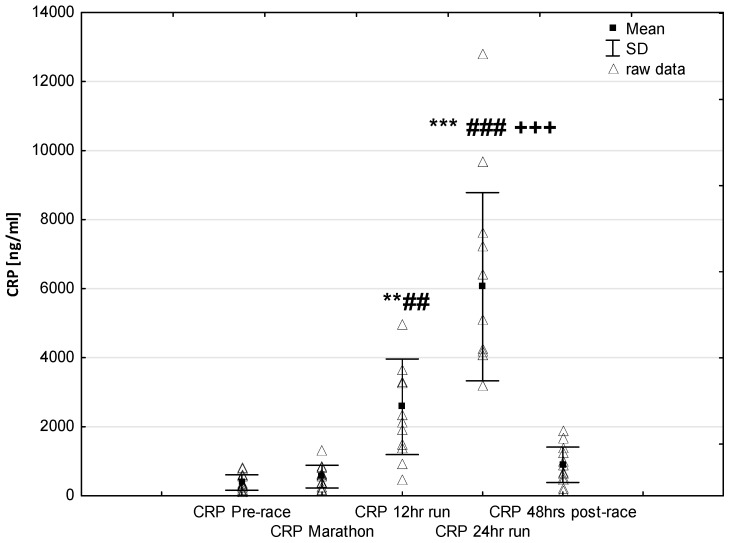
Figure 4.
Ultra-marathon-induced changes in serum high sensitive C-reactive protein (hsCRP). ** p < 0.01, *** p < 0.001 versus the corresponding pre-race value (Pre-race); ## p < 0.01, ### p < 0.001 versus the corresponding post-marathon value (Marathon); +++ p < 0.001 versus the corresponding post 12-h run value (12-h run).

