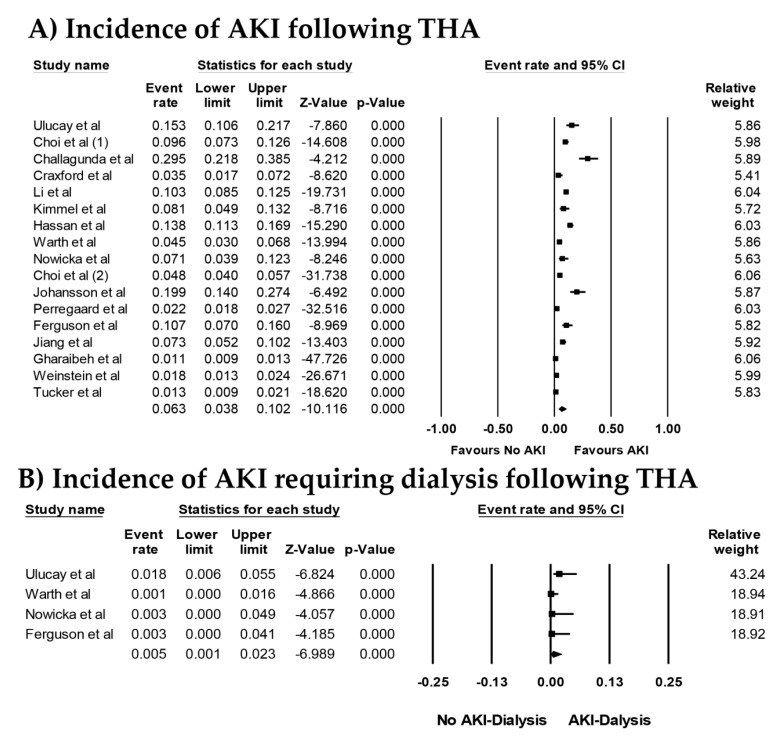
Figure 2.
Forest plots of the included studies [18,19,20,21,22,23,24,25,26,27,28,29,30,31,32,33] assessing (A) incidence rates of AKI and (B) incidence rates of AKI requiring dialysis following THA. A diamond data marker represents the overall rate from each included study (square data marker) and 95% confidence interval (CI).

