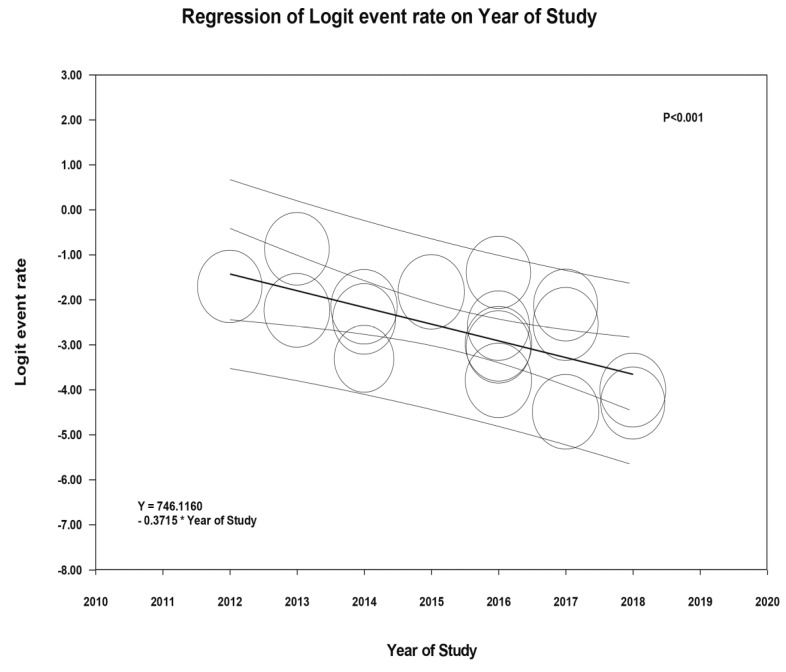
Figure 3.
Meta-regression analyses showed significant negative correlation between incidence of AKI following THA and the study year (slope = −0.37, p <0.001). The solid black line represents the weighted regression line based on variance-weighted least squares. The inner and outer lines show the 95% confidence interval and prediction interval around the regression line. The circles indicate log event rates in each study.

