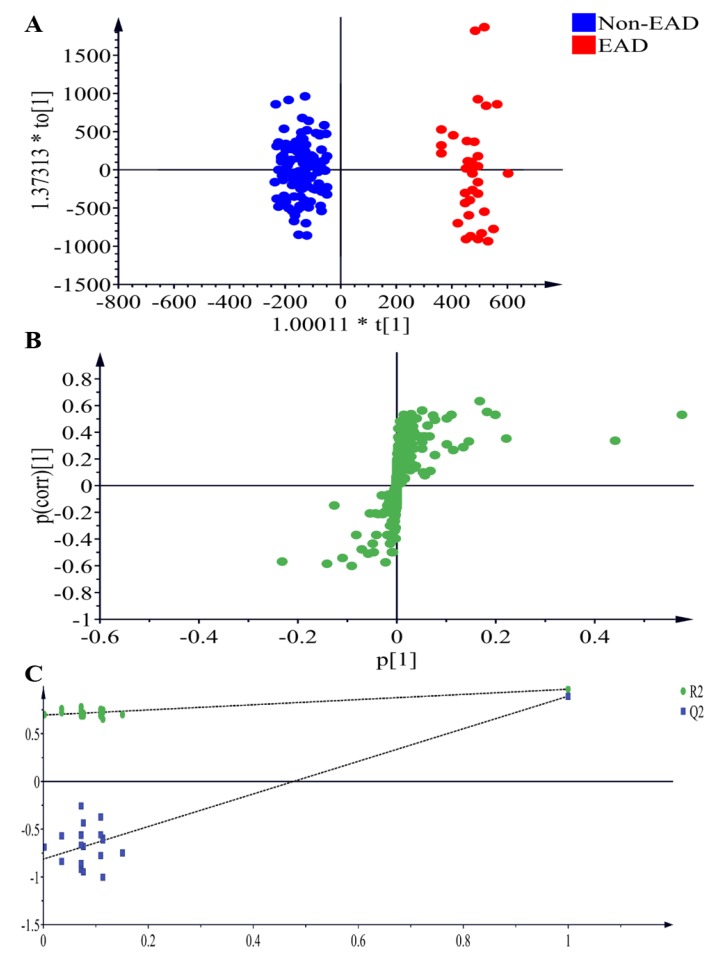
Figure 3.
Plasma samples analyzed by LC-MS in electrospray positive ion mode, comparing EAD and nonEAD recipients. (A) OPLS-DA scores plot presenting T6 EAD (red) and T6 Non-EAD (blue) with fitness and predictive power R2X = 0.895, R2Y = 0.965, Q2 = 0.893. (B) Metabolites with significant differences in electrosrapy positive ion modes between normal EAD and Non-EAD are presented in S-plots. (C) Validation of the OPLS-DA model by a class permutation analysis for (A). LC-MS, liquid chromatography coupled with mass spectrometry; OPLS-DA, orthogonal projection to latent structures-discriminant analysis; EAD, early allograft dysfunction.

