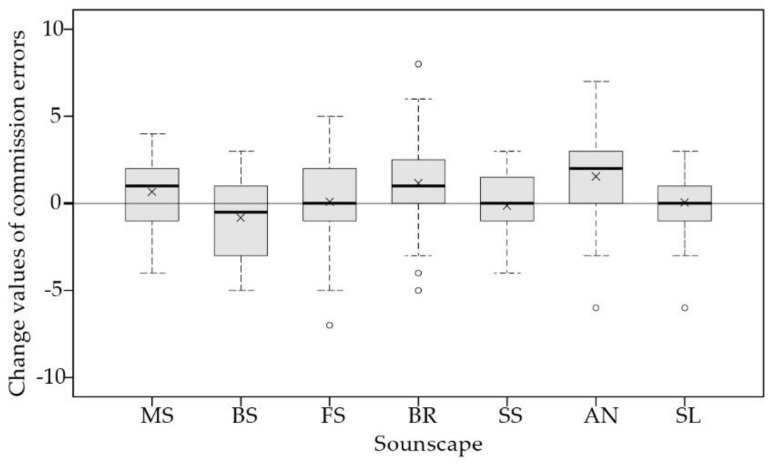
Figure 4.
Boxplots of change values of commission errors between soundscapes, showing median, interquartile range, maximum, and minimum values. The crosses represent mean values. MS, BS, FS, BR, SS, AN, and SL represent music, birdsong, fountain sound, bell ring, stream sound, ambient noise, and silence, respectively.

