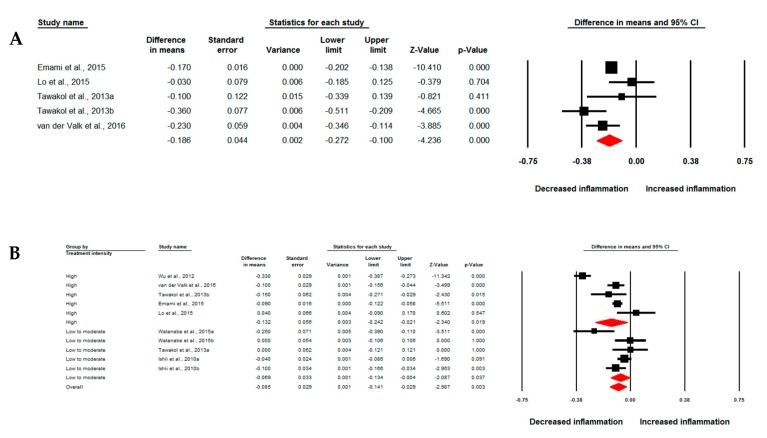
Figure 3.
Impact of statin treatment on FDG uptake of the most diseased arterial segment. Forest plot displaying weighted mean difference and 95% confidence intervals for the impact of statin therapy on arterial wall FDG uptake based on the most diseased segment of vessel TBR (A). (B) shows the results of meta-analysis stratified according to the intensity (high versus low-to-moderate) of statin therapy.

