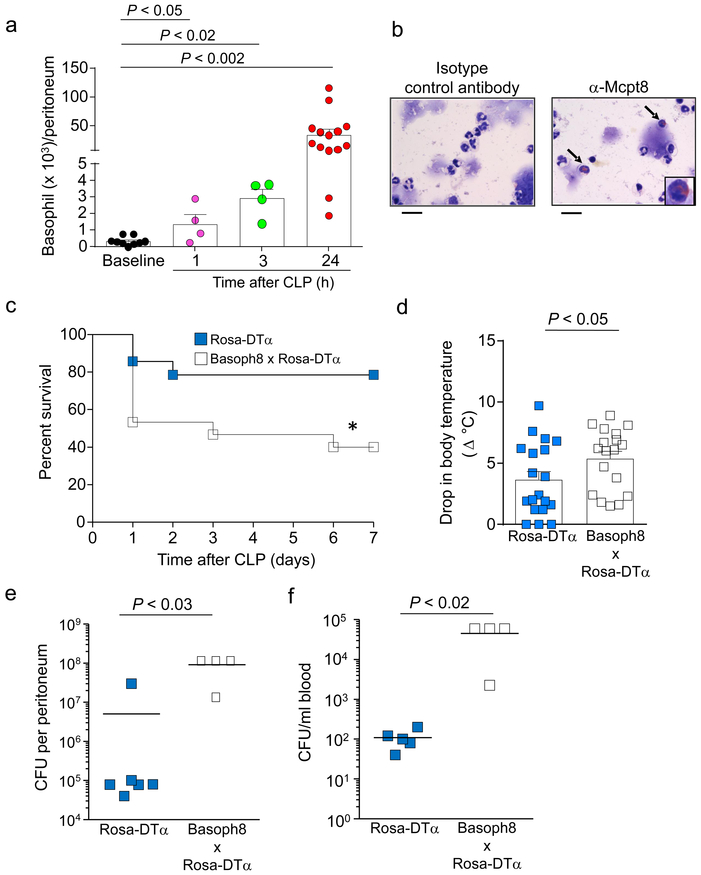
Figure 2. Basophil numbers increase in the peritoneal cavity and promote survival and bacterial clearance following CLP.
(a) Numbers of basophils (FcεRIα+ CD49b+ c-Kit– cells) in the peritoneal cavity at baseline (in naïve mice) or at 1, 3 or 24 h after induction of moderate CLP. Data were pooled from n = 3 independent experiments performed (n = 4 mice for 1 or 3 h after CLP and n = 12 mice for baseline or 24 h after CLP). Data in a are shown as mean + SEM with circles representing values from individual mice. P values by Mann-Whitney test. (b) Immunocytochemical analysis of basophils (some indicated by arrows) in cytospin preparations of CD49b+ peritoneal cells obtained 24 h after CLP and stained with anti-mouse Mcpt8 antibody (or with the same amount of an isotype control antibody of irrelevant antigen specificity) and counterstained with May-Grunwald/Giemsa stain. Scale bars=20 μm. Data are from one representative experiment of the n = 3 independent experiments performed, each of which gave similar results. (c) Survival after moderate CLP was higher in littermate control mice (Rosa-DTα; n = 14) than in basophil-deficient mice (Basoph8 x Rosa-DTα; n = 15). *P < 0.05 vs. Rosa-DTα by Logrank (Mantel-Cox test). (d-f) At 24 h after moderate CLP, drop in body temperature (d), and numbers of bacterial colony forming units (CFUs) in the blood (e) and peritoneal cavity (f), were greater in the basophil-deficient mice compared with their littermate controls. Data in d are shown as mean + SEM with squares representing values from individual mice (n = 19 for wild type mice and n = 18 for basophil-deficient mice). Data in e and f are shown as means with squares representing values from individual mice (n = 6 or 5 for wild type mice in e and f, respectively, and n = 4 for basophil-deficient mice in e and f). Data were pooled from the n = 3 independent experiments performed, each of which gave similar results. P values by Mann-Whitney test.

