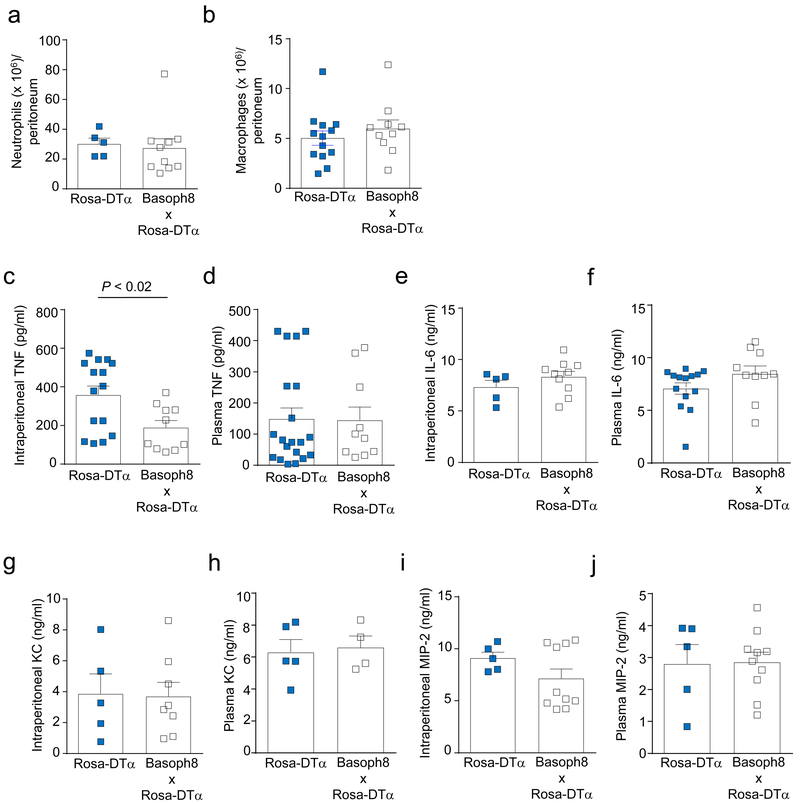
Figure 3. Basophils contribute to the increased TNF in the peritoneal cavity following CLP.
(a, b) Numbers of neutrophils (a) and macrophages (b) in the peritoneal live cell population analyzed by flow cytometry (Gr-1+ CD11b+ cells for neutrophils and F4/80+ CD11b+ for macrophages). Data in a and b are shown as mean + SEM with squares representing values from individual mice (n = 5 or 13 for wild type mice in a and b, respectively, and n = 10 for basophil-deficient mice in a and b). (c-j) Concentrations of TNF, IL-6, KC, and MIP-2 in the peritoneal cavity (c, e, g, i) and plasma (d, f, h, j) of ROSA-DTα and Basoph8 x ROSA-DTα mice at 24 h after CLP. Data are shown as means + SEM with squares representing values from individual mice (n = 15 in c, n = 20 in d, n = 5 in e, g–j and n = 14 in f for ROSA-DTα; and n = 10 in c-f, i, j, n = 8 in g, and n = 4 in h for Basoph8 x ROSA-DTα mice). Data were pooled from n = 3 independent experiments performed, each of which gave similar results. P values by Mann-Whitney test.

