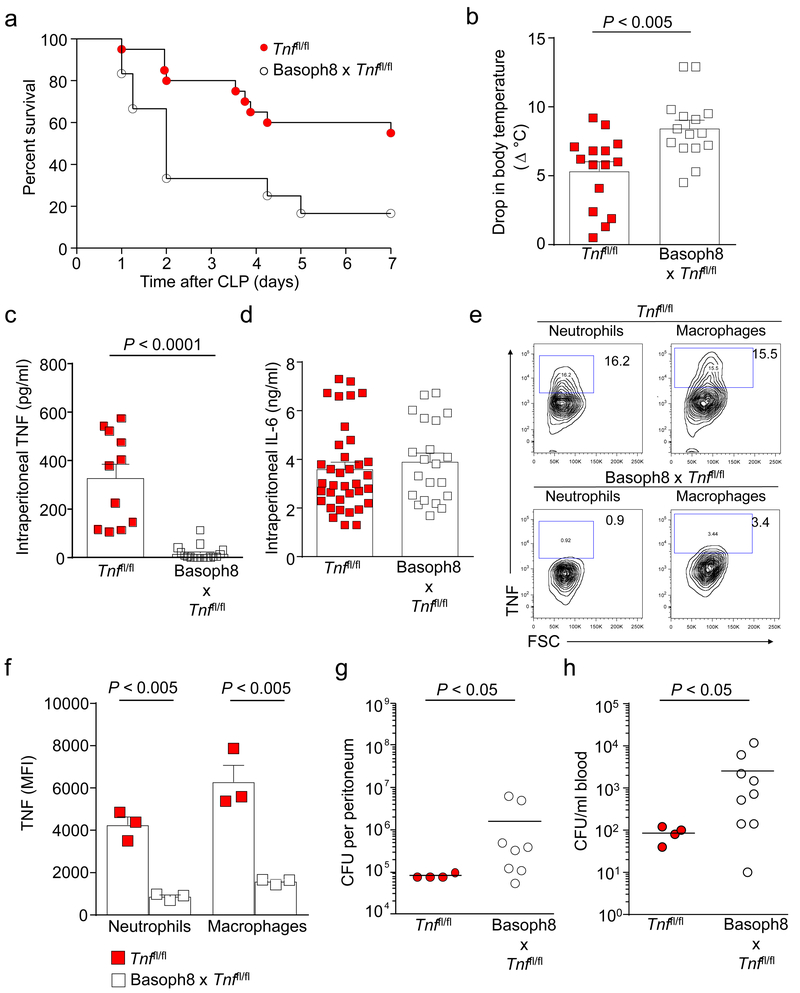
Figure 6. Basophil-derived TNF contributes to reduced morbidity and mortality, increased TNF concentrations, and enhanced bacterial clearance following CLP.
(a) Survival after moderate CLP was higher in the Tnffl/fl mice (n = 20) than in the Basoph8 x Tnffl/fl mice (n = 12). *P < 0.02 vs. Tnffl/fl mice by Logrank (Mantel-Cox test). Data were pooled from n = 3 independent experiments performed, each of which gave similar results. (b-d) Drop in body temperature (b) and levels of intraperitoneal TNF (c) and IL-6 (d) in Tnffl/fl mice and Basoph8 x Tnffl/fl mice at 24 h after CLP. Data in b-d, shown as means + SEM with squares representing values for individual mice (n = 15, n = 11 and n = 36 for Tnffl/fl mice in b, c and d, respectively, and n = 15 in b and c, and n = 21 in d for Basoph8 x Tnffl/fl mice). Data were pooled from the n = 3 independent experiments performed, each of which gave similar results. P values by Mann-Whitney test. (e, f) Flow cytometry plots (e) and mean intensity fluorescence (MFI) (f) for TNF positive cells in the neutrophil and macrophage populations obtained from the peritoneal cavity of Tnffl/fl and Basoph8 x Tnffl/fl mice at 24 h after CLP and then incubated ex vivo for 4 h in the presence of GolgiPlug. Cells were immunostained for TNF in addition to surface Gr-1 and CD11b to identify neutrophils or surface F4/80 and CD11b to identify macrophages. Data in e are from one representative experiment of the n = 3 independent experiments performed, each of which gave similar results. The data in f were pooled from n = 3 independent experiments that were performed, with each condition tested in duplicate. Data are shown as means + SEM with squares showing values for cells obtained from individual mice (n = 3/group). P values by Mann-Whitney test. (g, h) Peritoneal cavity (g) and blood (h) colony forming units (CFU) in Tnffl/fl mice and Basoph8 x Tnffl/fl mice at 24 h after CLP. Data in g and h are shown as means with squares representing values from individual mice (n = 4 for Tnffl/fl mice, and n = 8 and n = 9 for Basoph8 x Tnffl/fl mice in g and h, respectively). Data were pooled from the n = 3 independent experiments performed, each of which gave similar results. P values by Mann-Whitney test.

