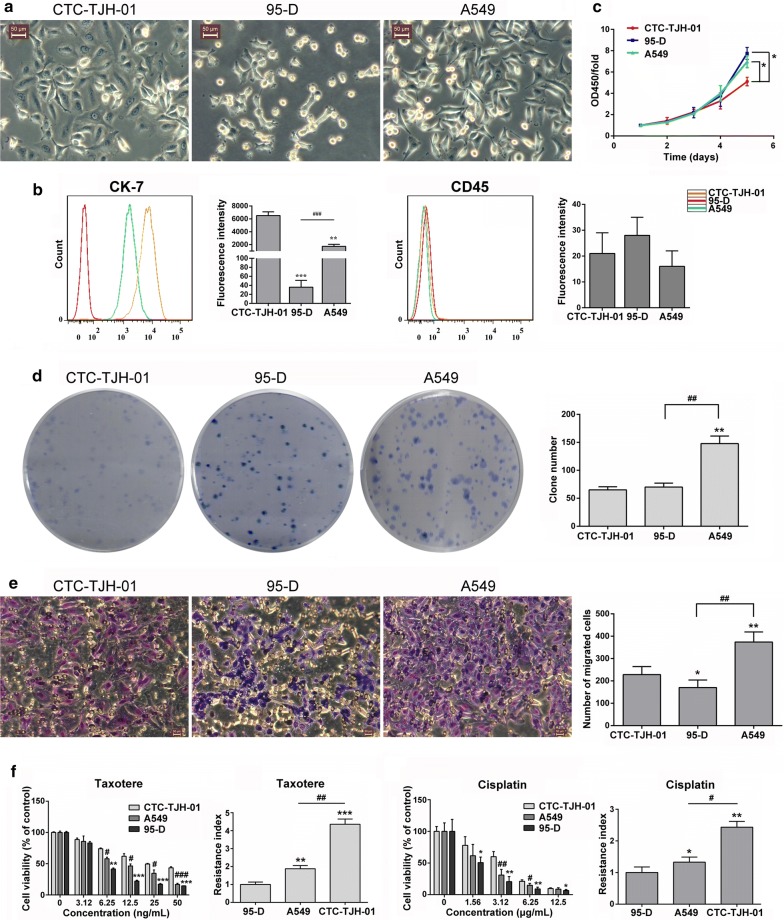
Fig. 1.
Distinct cell biological characteristics of CTCs. a Morphological observation of the CTC-TJH-01, 95-D and A549 cells under an inverted microscope. Scale bar, 50 μm. b Phenotype detection of CTC-TJH-01, 95-D and A549 cells. c Growth curve analyses of the CTC-TJH-01, 95-D and A549 cells. d Colony formation ability analyses of the CTC-TJH-01, 95-D and A549 cells. e Comparison of the transfer ability of the CTC-TJH-01, 95-D and A549 cells. f Comparison of the drug sensitivity of the CTC-TJH-01, 95-D and A549 cells to taxotere and cisplatin. Each bar represents the mean ± SD of three separate experiments. *P < 0.05; **P < 0.01; ***P < 0.001

