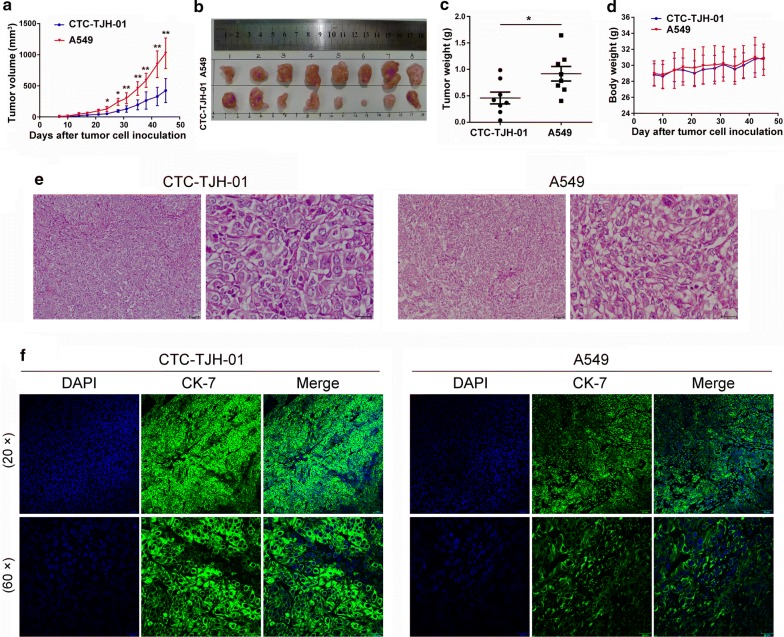
Fig. 4.
Subcutaneous CTC xenograft tumors exhibits tumorigenicity. a The growth curves of the tumors arising from the inoculation with CTC-TJH-01 or A549 tumor cells. Tumor growth was measured with a digital caliper. b A representative picture of the excised CTC-TJH-01 and A549 tumors from different mice on the 45th day after implantation. c Tumor weight was measured with an electronic balance. d Mice were weighed two times a week. e H&E staining of CTC-TJH-01 and A549 cell xenografts. Scale bar, 20 and 50 μm. f Immunofluorescence analyses of CK-7 expression levels in the CTC-TJH-01 or A549 tumor tissues. Scale bar, 20 and 50 μm. Each bar represents the mean ± SD of three separate experiments. *P < 0.05; **P < 0.01; ***P < 0.001

