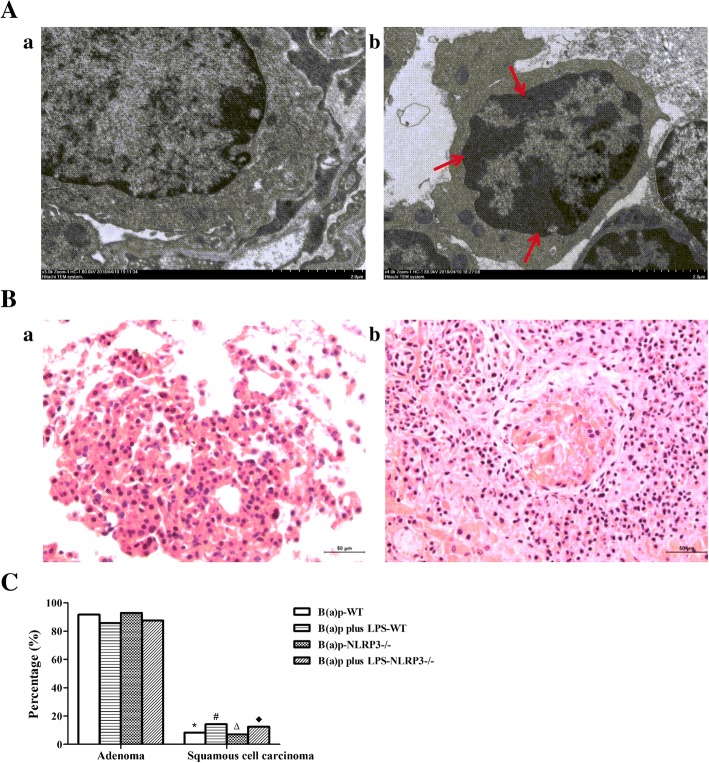
Fig. 6.
Lung adenoma and squamous cell carcinoma in WT mice and NLRP3−/− mice induced by B(a)p or B(a)p plus LPS. A Representative images of normal lung tissue (a) and tumor (b) by transmission electron microscopy in WT mice. B Representative images of lung adenoma (a) and squamous cell carcinoma (b) with amplification (200×). C The percentage of lung adenoma and squamous cell carcinoma induced by B(a)p or B(a)p plus LPS in WT mice and NLRP3−/− mice. Red arrows show heterochromatin in lung tumors induced by B(a)p plus LPS. *: vs B(a)p-WT, P < 0.05; #: vs B(a)p plus LPS-WT, P < 0.05; ∆: vs B(a)p-NLRP3−/−, P < 0.05, ♦: vs B(a)p plus LPS-NLRP3−/−, P < 0.05

