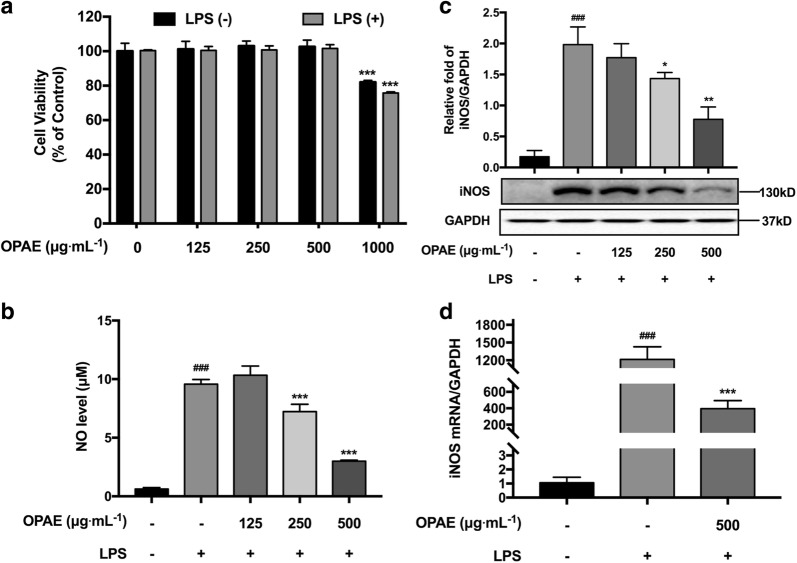
Fig. 3.
OPAE suppressed inflammatory response in LPS-stimulated RAW 264.7 macrophages. Cells were co-treated with OPAE at different concentrations (125, 250 and 500 mg mL−1) in the presence or absence LPS (1 µg mL−1) for 24 h. a Cell viability was measured with MTT assay. b NO production was determined by Griess reagent. c The expression of iNOS protein was determined by western blotting, GADPH was used as internal loading control. d The mRNA level of iNOS were analyzed by RT-qPCR, normalized to the GAPDH (n = 5). Data are expressed as mean ± S.D., n = 3. ###p <0.001 vs. Ctrl. group; *p <0.05, **p <0.01, ***p <0.001 vs. LPS group

