Figure 1.

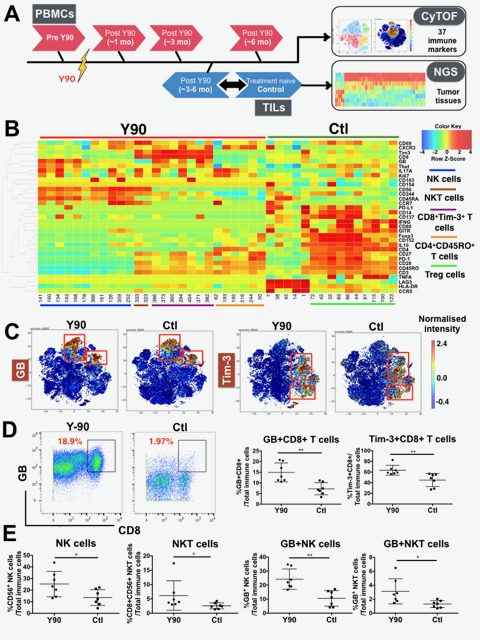
Immune profiles of tumour infiltrating leucocytes (TILs) isolated from Yttrium-90 (Y90)-radioembolisation (RE)-treated and treatment-naïve tumours. (A) Samples collection and analysis pipeline. Peripheral blood mononuclear cells (PBMCs) were collected before (pre-Y90) and at various time points after Y90-RE (post-Y90) (n=31 patients). TILs were collected from resected hepatocellular carcinoma (HCC) tumours from post-Y90-RE (downstaged on therapy) or treatment-naïve patients, control (Ctl) (n=7 for each group). time-of-flight mass-cytometry (CyTOF) was used to analyse both the PBMCs and TILs and next-generation sequencing (NGS) was performed on tumour tissues from post-Y90-RE and treatment-naïve patients (n=4 for each group). (B) Two-dimensional (2D) heat map showing the differential expression of immune markers by nodes enriched in TILs isolated from post-Y90-RE (red bar) or treatment-naïve (Ctl; green bar) HCC tumours. Enriched immune subsets in TILs from post-Y90-RE were CD56+natural killer (NK) cells, CD8+CD56+ NKT cells, CD8+ T and CD4+ T cells while regulatory T, Treg cells were enriched in TILs from Ctl HCC (colour-coded lines). n=7 each group. (C) 2D representation of granzyme B (GB) and Tim-3 expression on TILs isolated from post-Y90-RE (Y90) and Ctl HCC tumorstumours. Images were generated using MARVis software. () Representative plots showing the gating of GB on CD8+ T cells from post-Y90-RE (Y90) or Ctl TILs (left panel). Percentage of GB+CD8+ and Tim-3+CD8+ T cells from post-Y90-RE and Ctl TILs (right panel). () Percentage of CD56+ NK cells, CD8+CD56+ NKT cells, GB+CD56+ NK cells and GB+CD8+CD56+ NKT cells from post-Y90-RE (Y90) and Ctl TILs. Graphical data represent the means±SD and were analysed by unpaired Student’s t-test. *P<0.05 and **P<0.01.
