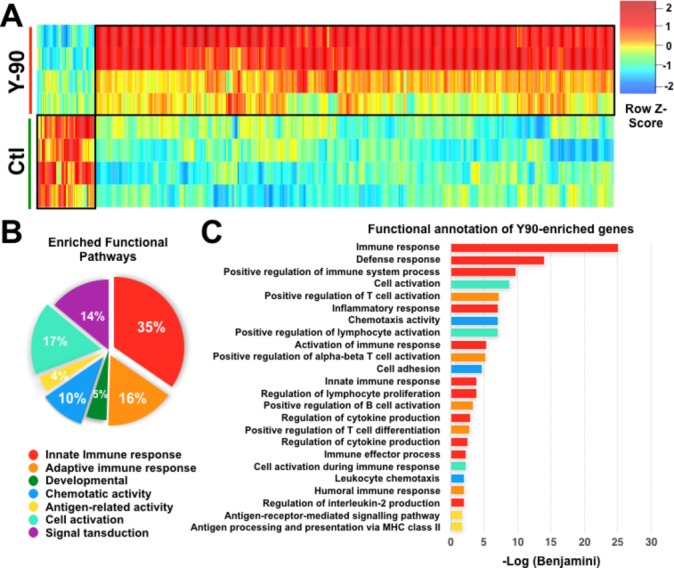
Figure 2.

Next-generation sequencing (NGS) and pathway analysis of post-Yttrium-90 (Y90)-radioembolisation (RE) and treatment-naïve (control (Ctl)) hepatocellular carcinoma (HCC) tumour tissues. (A) Heat map of differentially expressed genes (≥twofold) between Y90-RE-treated and Ctl tumour tissue (n=4 each group). (B) Percentages of major functional pathways enriched in Y90-RE-treated tumour tissues, analysed using DAVID Functional Annotation software. (C) Top-ranking functional pathways enriched in Y90-RE-treated vs Ctl tumour tissue using DAVID Functional Annotation software.
