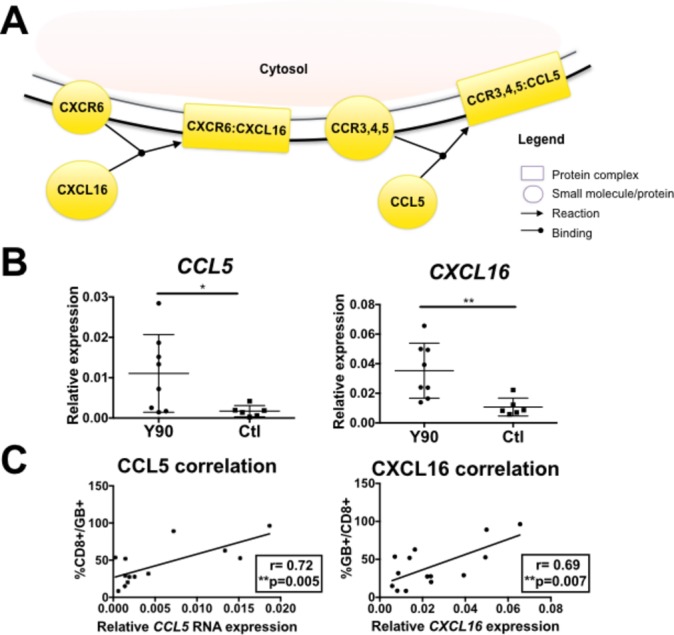
Figure 3.

Chemotatic pathways involving CCL5 and CXCL16 induced by Yttrium-90 (Y90)-radioembolisation (RE). (A) Reactome pathway analysis showed CXCL16-CXCR6 and CCL5-CCR5 chemotaxis pathways indicated by enriched genes in post-Y90-RE tumours. Boxes indicate protein complexes while circles indicated individual molecule/proteins. Yellow indicates involvement of enriched genes identified by our next-generation sequencing data. (B) RNA expression of CCL5 and CXCL16 in Y90-treated (n=8) vs control (Ctl) (n=6) tumour tissues by quantitative PCR analysis. (C) Correlation between RNA expression of CCL5 and CXCL16 and the percentage of tumour-infiltrating GB+CD8+-activated T cells (n=14). Graphical data represent the means±SD. P values and correlation coefficients (r) were calculated using the Pearson’s correlation test. *P<0.05 and **P<0.01.
