
Figure 6.
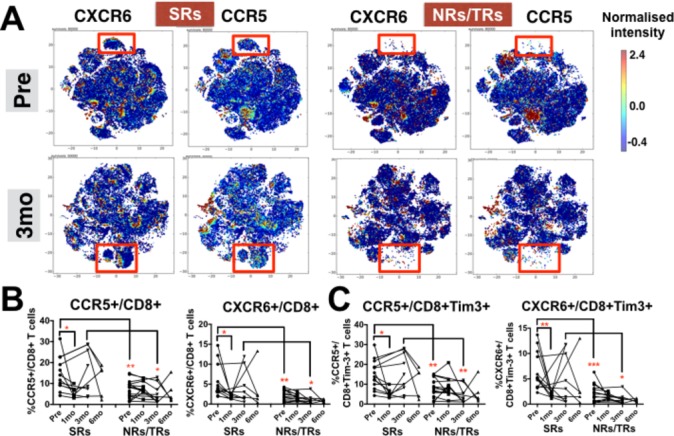
CXCR6+ and CCR5+ CD8 T cell subsets identify patients with hepatocellular carcinoma with sustained response to Yttrium-90 (Y90)-radioembolisation (RE). (A) Two-dimensional cellular illustration of CXCR6 and CCR5 on peripheral blood mononuclear cells (PBMCs) isolated before (pre) and 3 months (3 mo) after Y90-RE from sustained responders (SRs) and non-responders (NRs)/transient responders (TRs) patients. Images were generated using MARVis software. (B) Graphs show the percentages of CXCR6+CD8+ and CCR5+CD8+ T cells and (C) graphs show the percentages of CXCR6+CD8+Tim-3+ or CCR5+ CD8+Tim-3+ T cells. B and C, data obtained from PBMCs isolated from SRs or NRs/TRs patients before (pre) and at various time points (1, 3 and 6 mo) after Y90-RE. Graphical data represent the means±SD and were analysed by unpaired Student’s t-test. *P<0.05 and **P<0.01.