Figure 7.

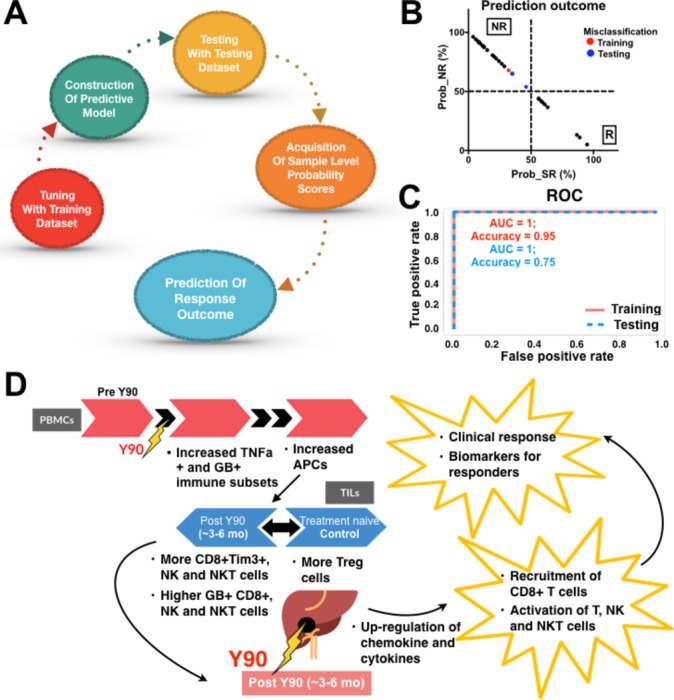
Prediction model for sustained response to Yttrium-90 (Y90)-radioembolisation (RE). (A) Construction of the Random Forests predictive model from time-of-flight mass-cytometry data to predict a final response outcome for each patient. (B) Probability (Prob) of being classified as either NR (non-responders (NRs)/transient responders (TRs)) or R (sustained responders (SRs)). The cut-off was where R ≥50% classified the samples to the SR group while R<50% classified them to the NR group. Red (training) and blue (testing) highlight where cases were misclassified by the model. (C) Receiver operating characteristic (ROC) curve from Random Forests prediction method to predict sustained response after Y90-RE in the training cohort n=22 and validation cohort n=8. AUC, area under the curve. (D) Model showing a series of immune responses induced by Y90-RE in tumour-infiltrating lymphocytes (TILs) and peripheral blood mononuclear cells (PBMCs). In TILs from Y90-RE-treated tumours, an increase in infiltration of granzyme B (GB)-expressing CD8+, natural killer (NK) cells and NKT cells was observed after Y90-RE vs more TREG in the treatment-naïve control tumours. Y90-RE-induced upregulation of chemokines is hypothesised to link to CD8+ T cells recruitment and activation. At 1 mo and 3 mo post-Y90-RE, immune activation of tumour necrosis factor (TNF)-α-expressing and GB-expressing immune subsets and antigen-presenting cells (APCs) was observed in PBMCs. The immune profiles of SRs could serve as a superior biomarker for clinical response to Y90-RE.
