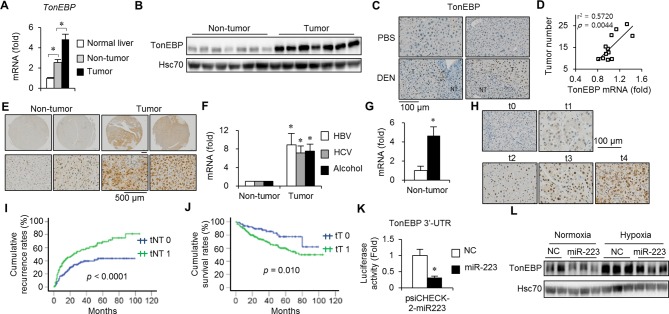
Figure 1.
Hepatic TonEBP expression is elevated in HCC and associated with postoperative recurrence and death in patients with HCC. (A–D) Hepatic TonEBP expression in a mouse model of HCC. (A) TonEBP mRNA levels in tumour-free normal tissues from PBS-injected animals (n=8) and non-tumour and tumours from DEN-injected animals (n=18). Mean+SEM, *P<0.05. (B) Immunoblots of non-tumour and tumours from seven animals. (C) Immunohistochemical images of TonEBP (brown) in hepatic tissues from PBS-injected or DEN-injected animals. Nuclei were counterstained with haematoxylin (blue). (D) Tumour number and TonEBP mRNA in non-tumour in individual animals were plotted (n=12). (E–G) TonEBP expression in hepatic tissues of patients with HCC. (E) Representative immunohistochemical images of TonEBP in hepatic biopsies from patients with HCC. (F) TonEBP mRNA in non-tumour and tumour was measured from patients with HBV- (n=23), HCV- (n=7) and alcohol-associated HCC (n=8). Tumour TonEBP expression of each patient was normalised to its non-tumour region TonEBP expression. Mean+SEM, *P<0.05 compared with corresponding non-tumour. (G) Non-tumour TonEBP mRNA was measured from patients who had recurrence within 2 years of resection (solid bar, n=16) and those who did not (open bar, n=21). Mean+SEM, *P<0.05 compared with the open bar. (H) Representative images of TonEBP immunohistochemical staining of non-tumour from tissue arrays processed simultaneously. Staining intensity was assigned to five grades as shown (t0–t4). (I) Kaplan-Meier plot of postoperative recurrence in two layers of patients: tNT0 (t0, n=130) versus tNT1 (t1–t4, n=166). (J) Kaplan-Meier plot of postoperative survival in two layers of patients tT0 (t0–1, n=80) versus tT1 (t2–4, n=216). (K) HEK293 cells were transfected with microRNA (miR)-223 or NC, followed by transfection of a luciferase reporter construct containing 3′-UTR of TonEBP with a putative miR-223-binding site. Luciferase activity is shown in mean+SD (n=3). *P<0.05 compared with NC. (L) HepG2 cells were transfected with miR-223 or NC followed by a 12-hour hypoxia or normoxia. TonEBP and Hsc70 immunoblotting was performed. DEN, diethylnitrosamine; HCC, hepatocellular carcinoma; mRNA, messenger RNA; NC, non-specific control RNA; NT, non-tumour; PBS, phosphate-buffered saline; TonEBP, tonicity-responsive enhancer-binding protein; T, tumour; UTR, untranslated region.

