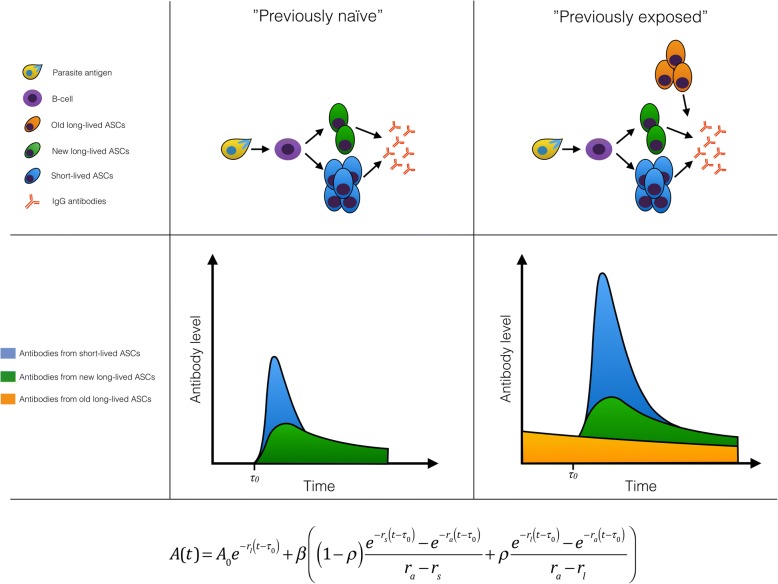
Fig. 1.
Schematic representation of the antibody kinetics model. The top row represents how the model captures the underlying immunological processes in both exposure groups, the middle row depicts the change in antibody levels over time (blue, antibodies generated by short-lived antibody-secreting cells (ASCs); green, antibodies generated by newly formed long-lived ASCs; orange, antibodies generated by previously established long-lived ASCs), and the bottom row displays the model equation. It is assumed that at time τ0, prior to presentation to hospital, antigen exposure leads to the proliferation and differentiation of B cells generating an amount β of antibody-secreting cells (ASCs). A proportion of the ASCs (ρ) are long-lived (green) and decay at rate rl while a proportion (1 − ρ) are short-lived (blue) and decay at rate rs. All ASCs produce antibodies that decay at rate ra. Previously exposed individuals, who have had prior P. falciparum infections, may maintain a level of antibodies (A0) generated by old long-lived ASCs (orange) from previous infections, which decay at rate rl and produce antibodies that decay at rate ra. Previously naïve individuals, who suffer a primary P. falciparum infection, are assumed to have no pre-existing antibodies or ASCs at the onset of infection (A0 = 0)

