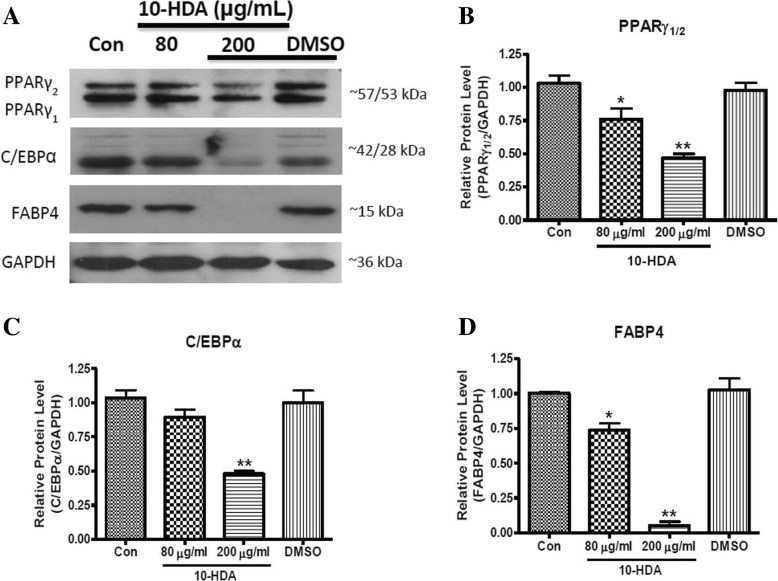
Fig. 4.
Effects of 10-HDA on protein expression level of PPARγ, C/EBPα, and FABP4 during 3 T3-L1 adipocyte differentiation. a The blot represented the protein expression levels of different transcription factors. The band intensities of (b) PPARγ, (c) C/EBPα, and (d) FABP4 were measured and normalized to GAPDH. The data shown are presented as means ± SD of triplicate experiments. Statistical significance was calculated using one-way ANOVA followed by Dunnett’s multiple comparisons test. *P < 0.05 vs control; **P < 0.01 vs control

