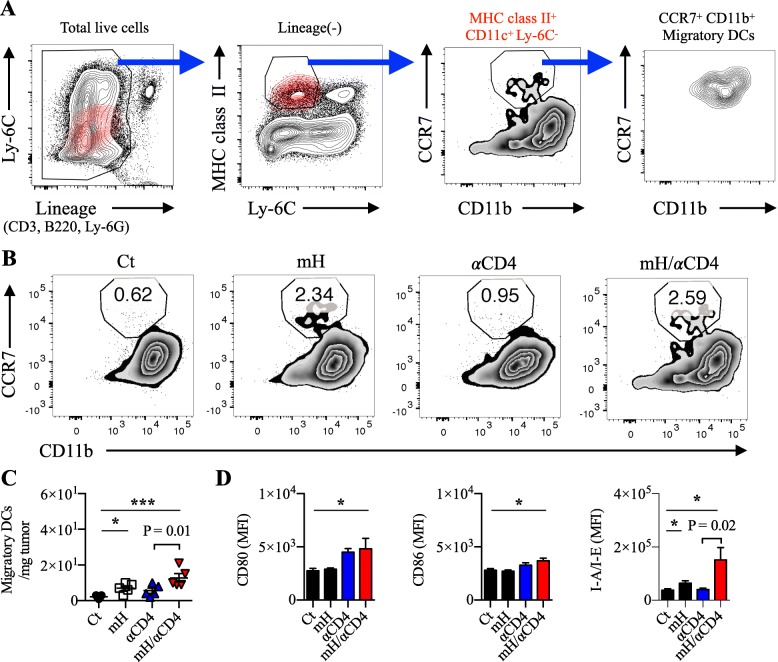
Fig. 3.
HMGN1/αCD4 treatment increased CCR7+CD80hiCD86hi migratory DCs in the tumor. a Flow cytometry gating of CCR7+ migratory DCs. b, c The frequency and number of CCR7+ migratory DCs in the tumor. d The expression of CD80, CD86, and I-A/I-E (also known as MHC class II) on CCR7+ migratory DCs. Each result is representative of three independent experiments with at least four mice per group. Data are presented as mean ± SEM. *, P < 0.05, **, P < 0.01, ***, P < 0.001 for a dunnett’s post hoc test (compared with control); p values in the figure indicate Student’s t-test comparing mH/αCD4-treated and αCD4-treated groups. Mean fluorescence intensity (MFI)

