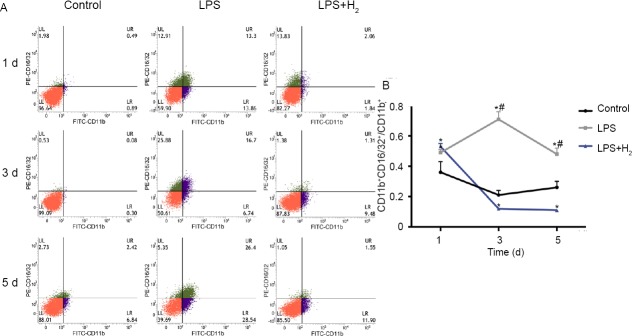
Figure 2.
Flow cytometry of M1 macrophages at 1, 3 and 5 d.
Note: (A) M1 macrophages are CD11b+CD16/32+. Green: CD16/32+ cells; purple: CD11b+ cells; red: CD16/32– and CD11b– cells. (B) At different time points, the proportion of M1 macrophages remained stable in the control group, and it increased in the LPS group over time. The hydrogen reduced the proportion significantly when compared with LPS group. *P < 0.05, vs. control group; #P < 0.05, vs. LPS + H2 group. LPS: Lipopolysaccharide; H2: hydrogen; d: day(s).

