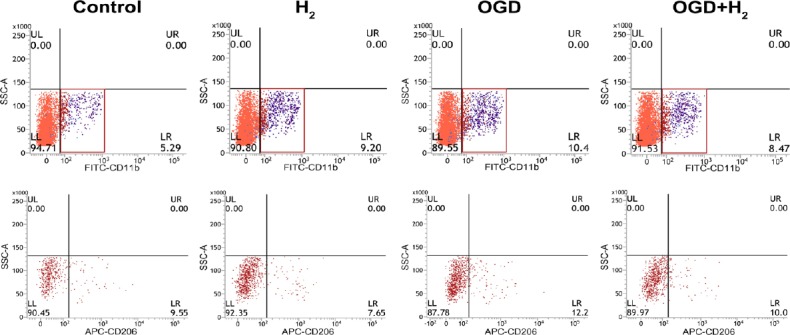
Figure 5.

The phenotype of microglia was detected at 24 hours. Microglia were CD11b+ cells and M2 microglia were CD206+.
Note: Red boxes in the first row represent the selected gates including microglias, and the regions with different colors represent the signals of different cell population. Red regions in the second row represent CD206+ cells, and the fourth quadrantal area represents the high signal. OGD: Oxygen and glucose deprivation; H2: hydrogen.
