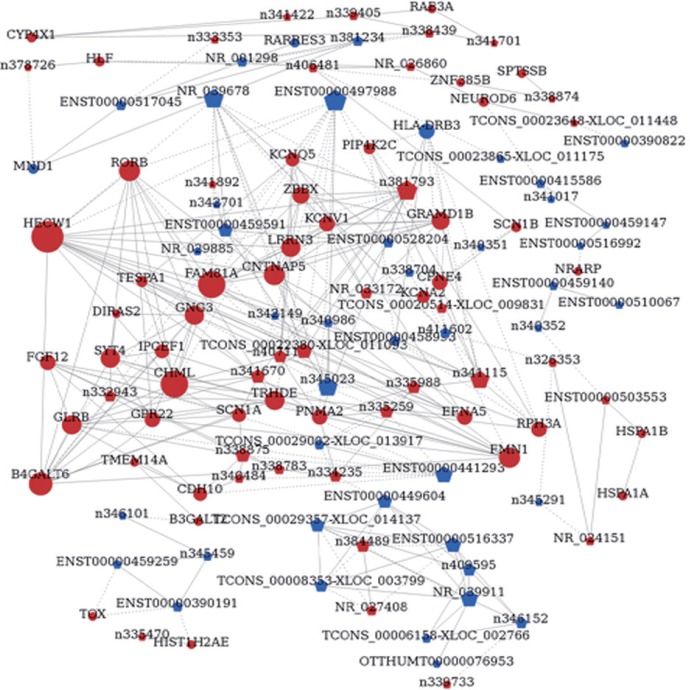
Figure 3.
LncRNA-mRNA network analysis of frontotemporal traumatic brain injury tissue.
Dots represent mRNAs, and pentagons represent lncRNAs. Red color represents up-regulated mRNA or lncRNA, and blue color represents down-regulated mRNA or lncRNA. Node size represents the degree of change. Solid line indicates a positive correlation, and dashed line indicates a negative correlation.

