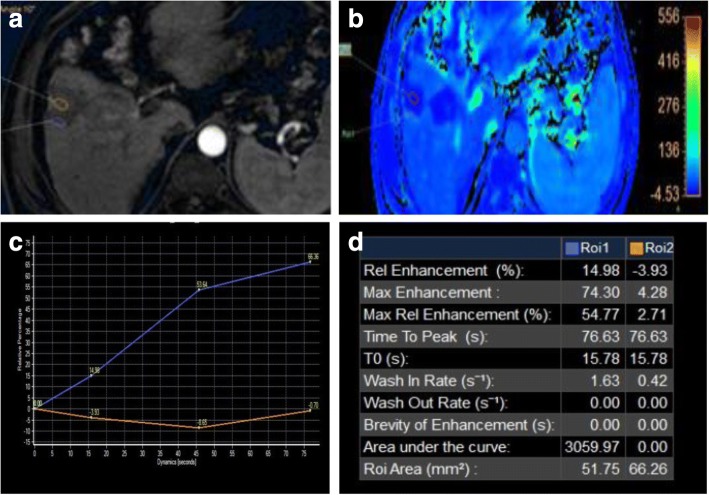
Fig. 13.
Two hepatic focal lesions after RFA. a Subtracted enhanced T1-WI in the arterial phase shows faint enhancement of the periphery of the treated HFLs (ROI 1 “blue”) compared to the center of HFLs (ROI 2 “orange”). b T1 perfusion map (max. relative enhancement) shows mild increased blood flow peripherally. c Time-intensity curves on the periphery of the treated HFLs (blue) and their center (orange) show an uprising slope due to inflammation. d Semi-quantitative data for both ROIs show significant decreased max. relative enhancement of the center of treated HFLs compared to the periphery. Final diagnosis is LR-TR nonviable with post-therapy changes

